Antimicrobial Activity of Some Medicinal Plants Extracts Against Food Industry Isolates
Antimicrobial Activity of Some Medicinal Plants Extracts Against Food Industry Isolates
Iram Liaqat1*, Najma Arshad2, Muhammad Arshad3, Safdar Ali Mirza4, Nazish Mazhar Ali1 and Ammara Shoukat1
A, Growth curves of antibiotics resistant isolates; B, Growth of antibiotics resistant isolates at different pHs (4,5,6,7,8,9,10); C, Growth curves of antibiotics resistant isolates at different temperatures (25°C, 37°C, 45°C, 55°C and 60°C) for 24 h.
A, Time course of biofilm formation by the three food industry isolates E. Cloacae sp. (GenBank accession no. KM658273), E. coli (KM658274) and E. ludwigii (KM658275) by test tube method; B, By cover slip assay. Data were obtained from the average of three independent experiments.
MIC and MBC determination of aqueous and methanolic plant extracts against food industry isolates. A, E. Cloacae sp. (GenBank accession no. KM658273); B, E. coli (KM658274) and C, E. ludwigii (KM658275).
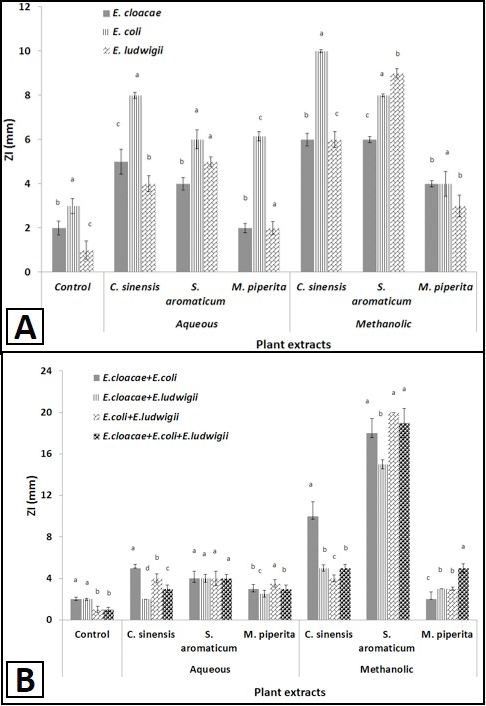
Comparison of antibacterial activity of plant extracts on monoculture (A) and mixed culture (B) food industry isolates in planktonic mode. Data was analyzed in SPSS (Version 13.0) using one way ANOVA followed by post hoc Turkey test. Bars having no common superscript are significantly different at p<0.05.
Comparison of antibacterial activity of plant extracts on monoculture (A) and mixed culture (B) food industry isolates in biofilm mode. Data was analyzed in SPSS (Version 13.0) using one way ANOVA followed by post hoc Turkey test. Bars having no common superscript are significantly different at p<0.05.


