

Aqueous Myrrh Extract Relieves Oxidative Stress-Dependent Nephrotoxicity Induced by Ethanol in Male Rats


Aqueous Myrrh Extract Relieves Oxidative Stress-Dependent Nephrotoxicity Induced by Ethanol in Male Rats
Abeer Alahmari1,2*

Effect of aqueous myrrh extract (AME) on histological structure of rat kidney. A, Renal cortex of CTR rats showing normal Malpighian corpuscle containing the glomerulus (G) and Bowman’s space (BS), proximal convoluted tubules (P), and distal convoluted tubules (D). B, Renal medulla of CTR rats showing normal collecting tubules (CT). C and D, Renal sections of rats treated with AME only showed no significant alterations in the structure of the renal cortex (C) and medulla (D). Scale bar =500 µm; Stain: H & E. Magnification: 400 ×.
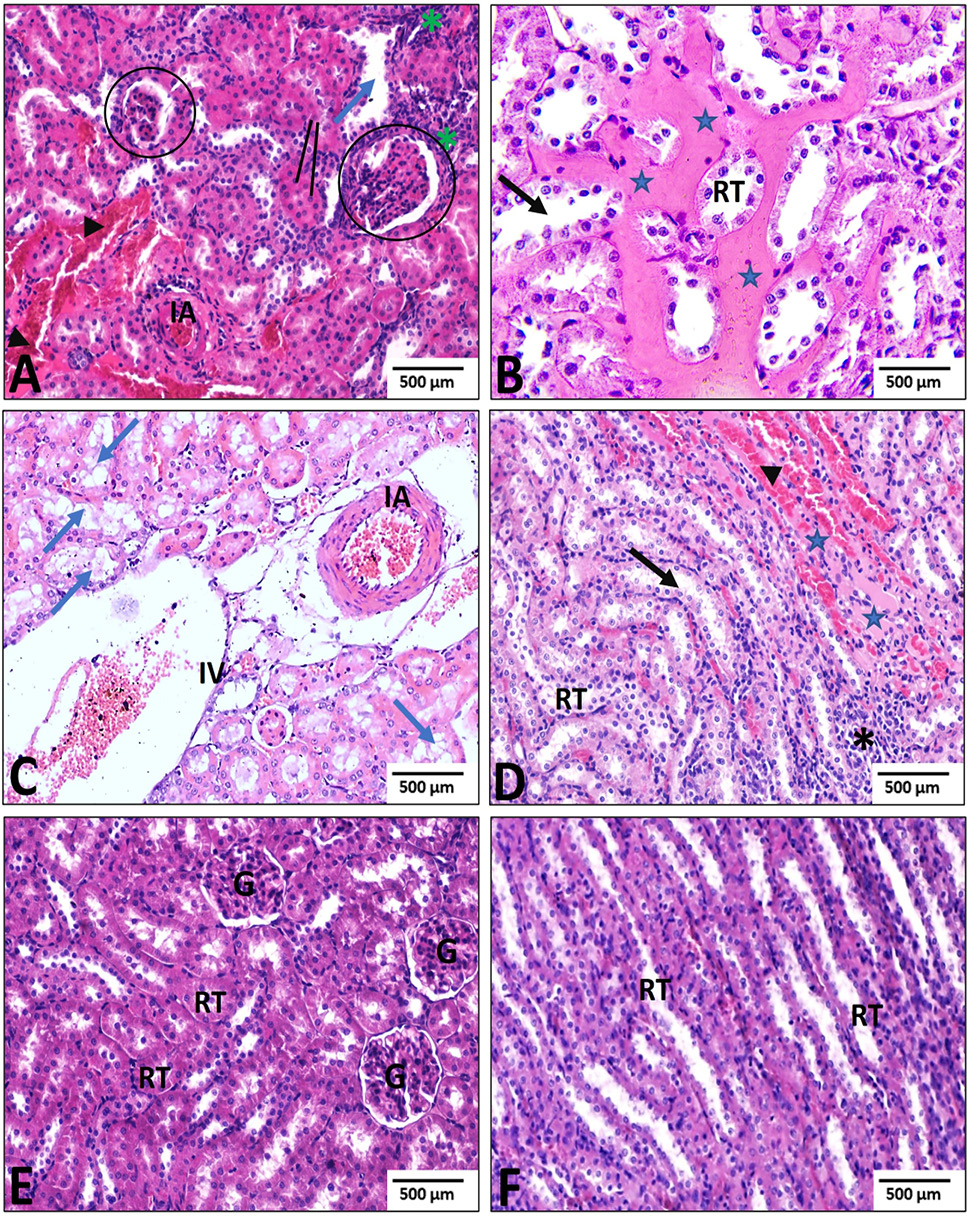
Effect of aqueous myrrh extract (AME) on histological structure of Ethanol (EtOH) and EtOH + AME-treated groups. A–D, Renal tissue of rats from the EtOH-treated group showing shrunken glomeruli (circle), inflammatory infiltration (*), tubular cell necrosis with vacuolization (blue arrow), dilation of tubular lumens (black arrow), interstitial edema (star), tubular congestion (arrowhead), pyknotic nuclei in most epithelium lining the tubules (line), and expansion of interlobular veins (IV). E and F, Renal sections of rats treated with EtOH + AME showing improved histopathological changes in the renal cortex (E) and medulla (F). G, glomeruli; RT, renal tubule. Scale bar =500 µm; Stain: H & E. Magnification: 200 and 400 ×.
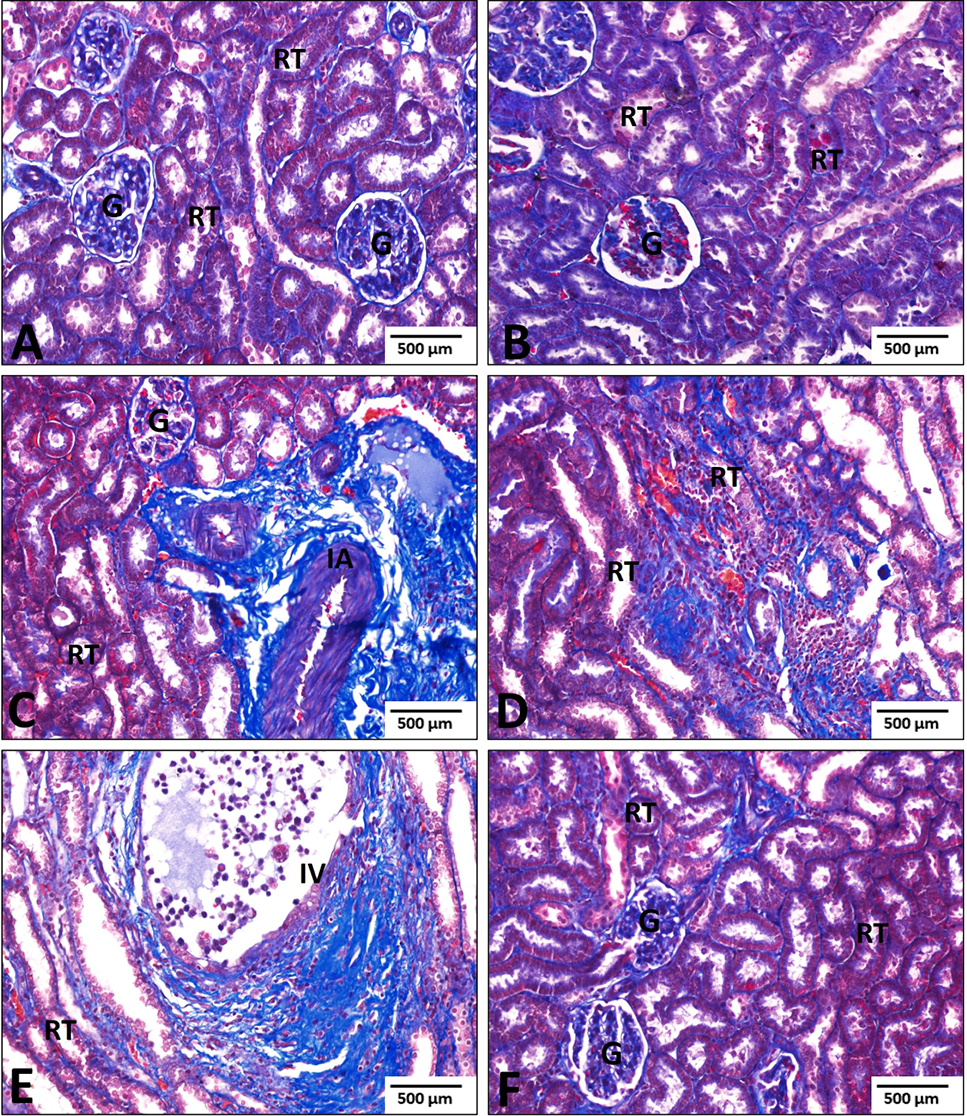
Images of Masson’s trichrome-stained sections of renal tissues from the CTR and experimental groups. A and B, the renal tissues of CTR and AME-treated rats showed a normal distribution of collagen (blue) in the glomeruli (G) and between renal tubules (RT). C-E, the renal tissue of EtOH-treated rats showed a high deposition of collagen fibers (blue) between the renal tubules and around the interlobular vein (IV) and artery (IA). F, the renal tissue of EtOH + AME-treated rats showed mild deposition of collagen fibers (blue) in the glomeruli (G) and between renal tubules (RT). Scale bar =500 µm; 200 ×.
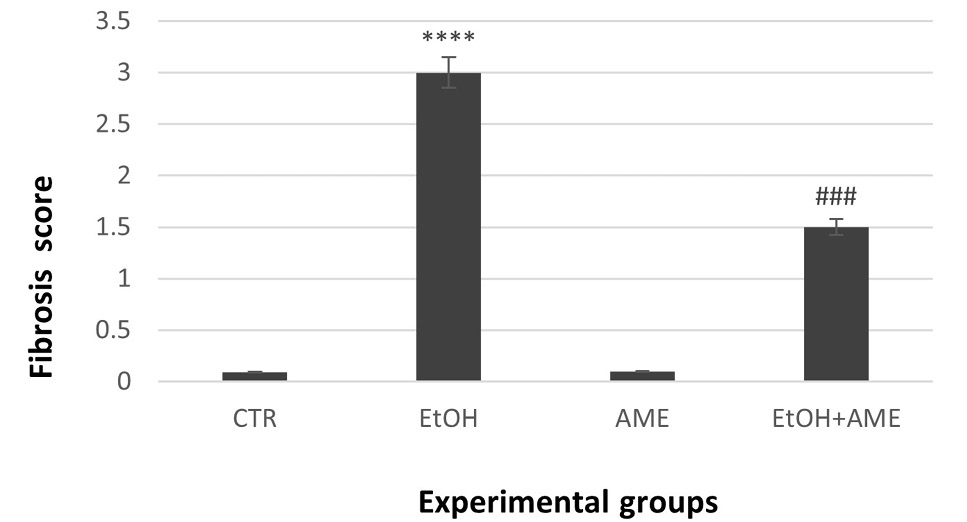
Semiquantitative estimation of renal fibrosis scores in the experimental groups. All values are expressed as the mean ± standard error (SE). CTR, control; EtOH, 40% ethanol (3 g kg-1); AME, aqueous myrrh extract (500 mg kg-1); and EtOH + AME, 40% ethanol followed by aqueous myrrh extract. *p > 0.05 and ****p > 0.0001 vs. CTR; ###p > 0.001 vs. EtOH.

