Control of Ichthyophthirius multifiliis Infecting African Sharptooth Catfish Clarias gariepinus Using Ocimum gratissimum
Control of Ichthyophthirius multifiliis Infecting African Sharptooth Catfish Clarias gariepinus Using Ocimum gratissimum
Chinenye Maria-Goretti Ohanu, Chika Bright Ikele*, Okoye, ChukwuEbuka Kingsley, Charity Chidera Eze
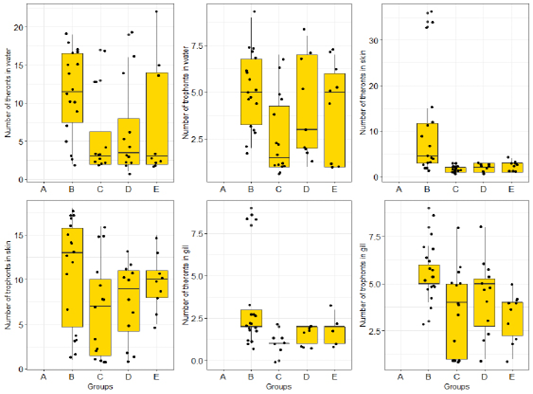
Intensity of Ichthyopthirius multifilis infection on Clarias gariepinus juvenile 48h pre-treatment with Ocimum gratissimum. Key: A: Normal control (not infected and not treated); B: Negative control (Infected, not treated); C: Standard control (infected and treated with 150mg/L chlomphenicol); D: 500mg/L Ethanolic leaves extract of O. gratissimum (ELEOG); E: 1500mg/L ELEOG.
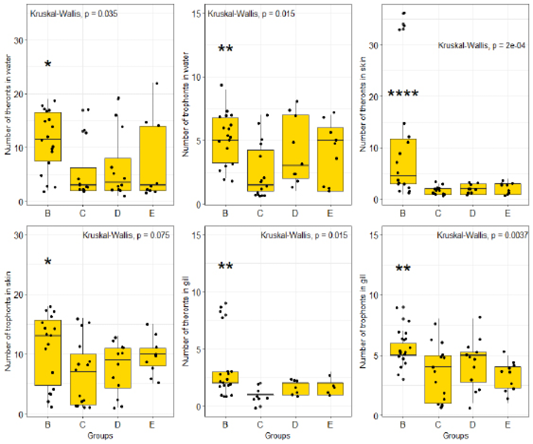
Intensity of Ichthyopthirius multifilis infection in Clarias gariepinus juvenile 24h pre-treatment with Ocimum gratissimum. Key: B: Negative control (Infected, not treated); C: Standard control (infected and treated with 150mg/L chloromphenicol); D: 500mg/L Ethanolic leaves extract of O. gratissimum (ELEOG); E: 1500mg/L ELEOG.
Theront intensity pre- and post-treatment with O. gratissimum extract in water. Key: A: Normal control (not infected and not treated); B: Negative control (Infected, not treated); C: Standard control (infected and treated with 150mg/L chlomphenicol); D: 500mg/L Ethanolic leaves extract of O. gratissimum (ELEOG); E: 1500mg/L ELEOG.
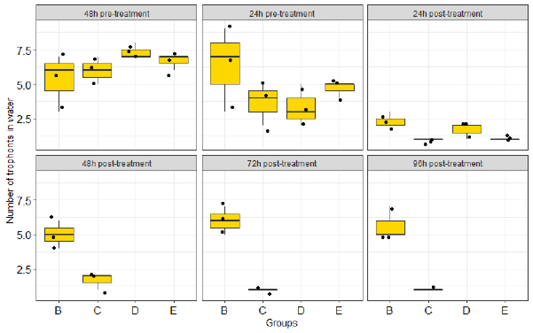
Trophont intensity pre- and post-treatment with O. gratissimum extract in water. Key: A: Normal control (not infected and not treated); B: Negative control (Infected, not treated); C: Standard control (infected and treated with 150mg/L chlomphenicol); D: 500mg/L Ethanolic leaves extract of O. gratissimum (ELEOG); E: 1500mg/L ELEOG.
Theront intensity pre- and post-treatment with O. gratissimum extract on the skin. Key: A: Normal control (not infected and not treated); B: Negative control (Infected, not treated); C: Standard control (infected and treated with 150mg/L chlomphenicol); D: 500mg/L Ethanolic leaves extract of O. gratissimum (ELEOG); E: 1500mg/L ELEOG.
Trophont intensity pre- and post-treatment with O. gratissimum extract on the skin. Key: A: Normal control (not infected and not treated); B: Negative control (Infected, not treated); C: Standard control (infected and treated with 150mg/L chlomphenicol); D: 500mg/L Ethanolic leaves extract of O. gratissimum (ELEOG); E: 1500mg/L ELEOG.
Theront intensity pre- and post-treatment with O. gratissimum extract on the gill. Key: A: Normal control (not infected and not treated); B: Negative control (Infected, not treated); C: Standard control (infected and treated with 150mg/L chloromphenicol); D: 500mg/L Ethanolic leaves extract of O. gratissimum (ELEOG); E: 1500mg/L ELEOG.
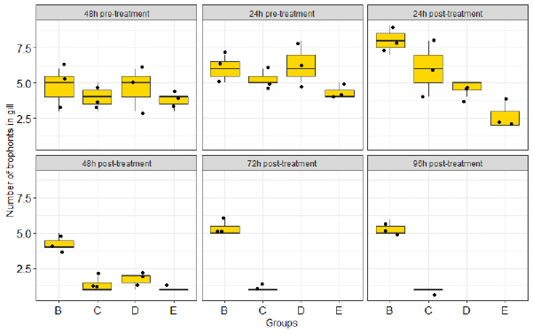
Trophont intensity pre- and post-treatment with O. gratissimum extract in gill. Key: A: Normal control (not infected and not treated); B: Negative control (Infected, not treated); C: Standard control (infected and treated with 150mg/L chloromphenicol); D: 500mg/L Ethanolic leaves extract of O. gratissimum (ELEOG); E: 1500mg/L ELEOG.
Changes in temperature in the experimental media.
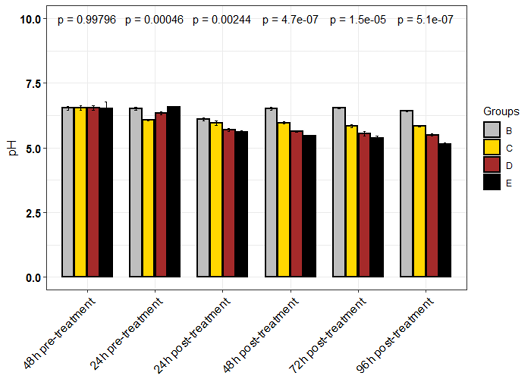
pH of experimental medium.
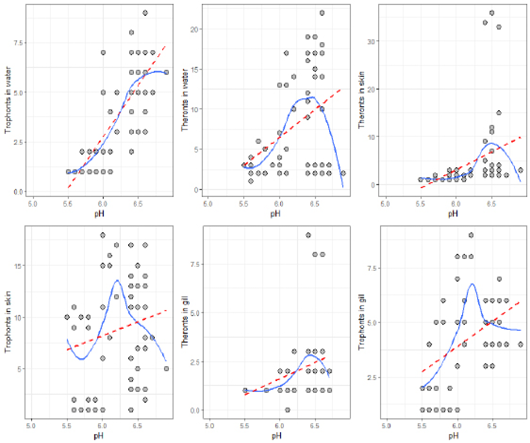
Relationship between culture water pH and intensity of I. multifiliis.
Trophont (Adult stage).
Theront (Infective stage).
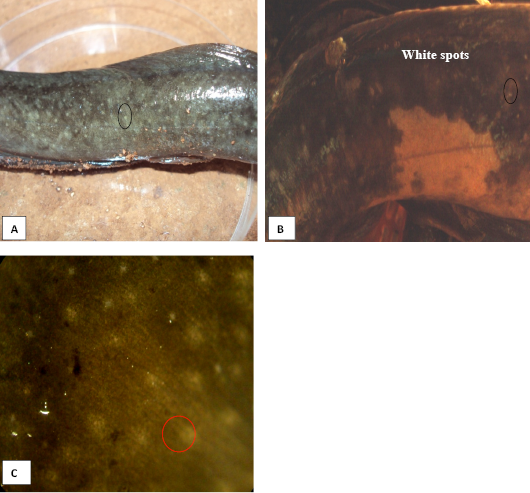
Gross morphology of infected Fish, Clarias gariepinus showing white spots (circles); A and B: Through visual observations; C: White spots under stereo microscope. Mag. 20X.


