Emerging Supply Chain of Pork and the Opportunities for Small-Scale Raisers in Catbalogan City in the Philippines
Emerging Supply Chain of Pork and the Opportunities for Small-Scale Raisers in Catbalogan City in the Philippines
Marcos E. Bollido1,2*, Renell Jay G. Villaluz1,2 and Ronald L. Orale1
Geo-reference map of the research area.
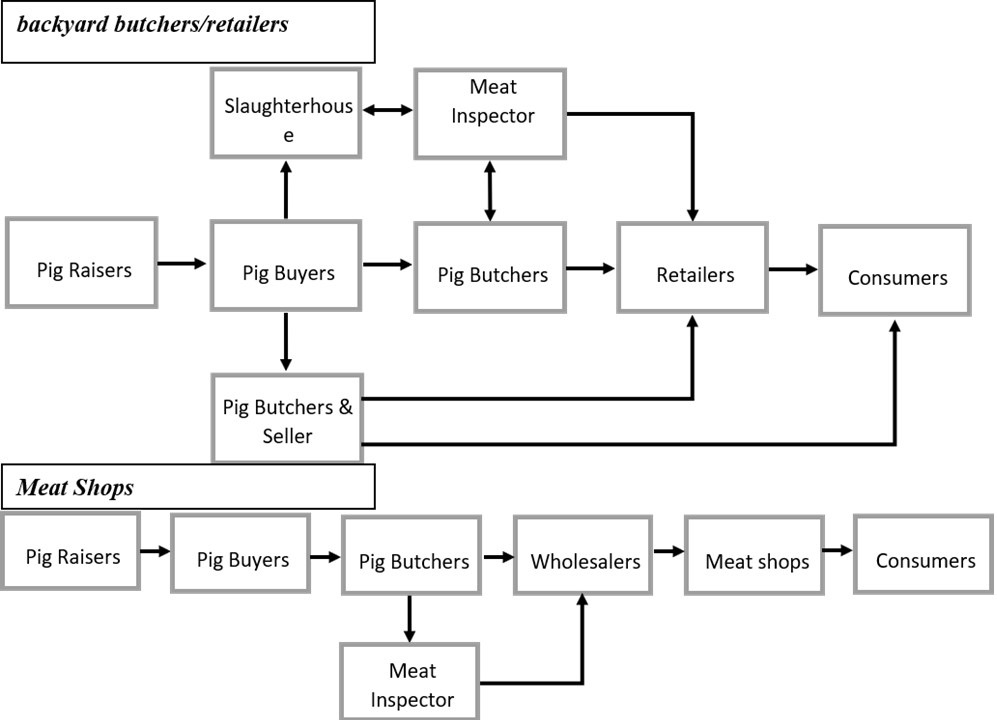
Marketing channels of pigs in Catbalogan City, Samar, Philippines.
Pork Supply Chain.
Time Series Plot for Trend of Pork Production and Consumption
Auto-correlation Function (ACF) and Partial Auto-correlation Function (PACF) plot of second differentiated data (a) Pork Production and (b) Pork Consumption.
Price’s trend of pork & carcass in five years
Live pigs & pork consumed in a year
Yearly supply and demand of pork and live pig
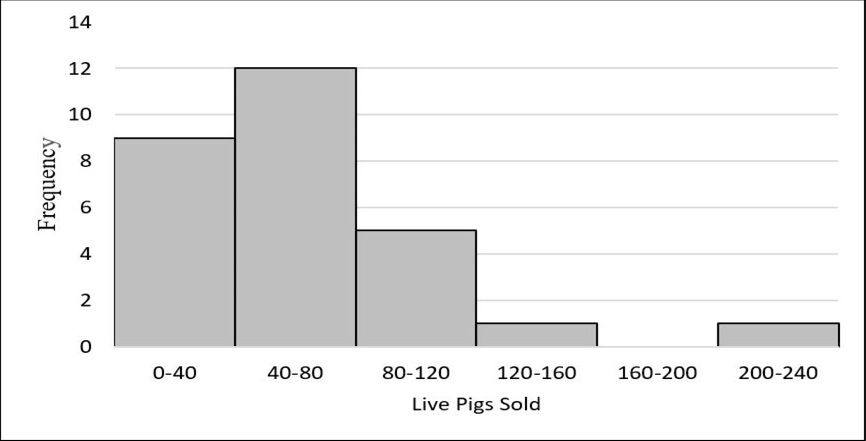
Liveweight pigs supply from backyard raisers and butchers
Pork supply from meat shops
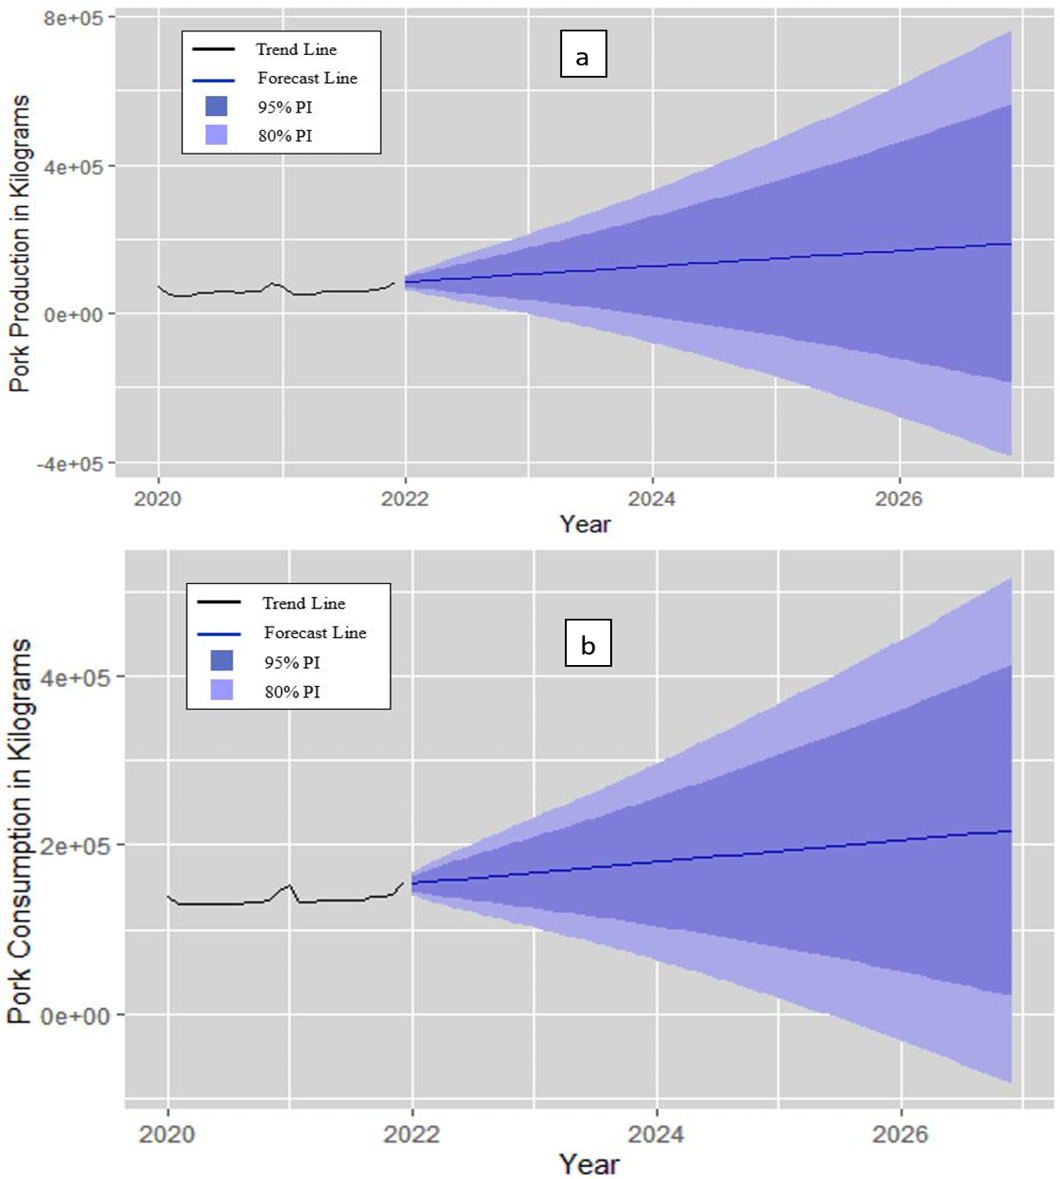
Forecasting of (a) Pork Production and (b) Pork Consumption


