

Enhanced Antitumor and Anti-Metastasis Efficiency via Combined Treatment with Carvacrol and Doxorubicin


Enhanced Antitumor and Anti-Metastasis Efficiency via Combined Treatment with Carvacrol and Doxorubicin
Hu-Hu Chen1,2, Xin Li2,3, Mohd Hijaz Mohd Sani2 and Siat Yee Fong2,4*
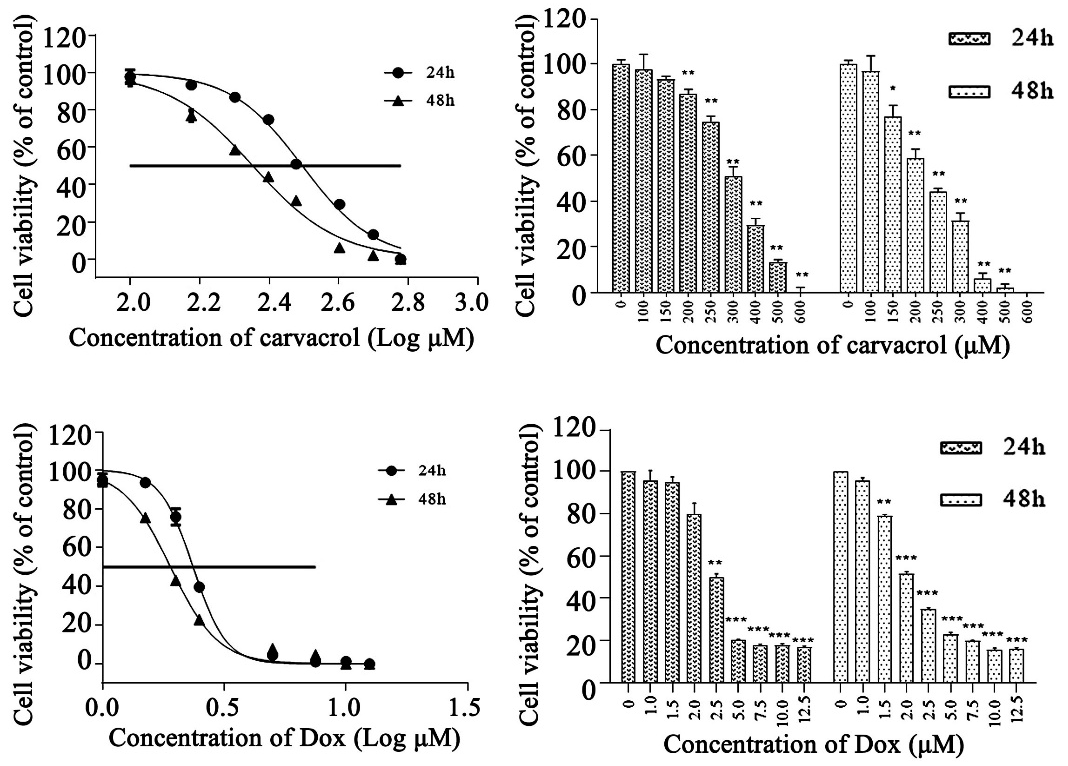
Fig. 1.
Dose and time-dependent inhibition of MDA-MB-231 cell growth exposed to various concentrations of carvacrol (A) and Dox (B) for 24 and 48 h by CCK-8 assay. Data present mean±SD (n = 3).
Notes: * p < 0.05, ** p < 0.01, *** p < 0.001, vs. Control (concentration 0 µM), Dox, doxorubicin concentration groups.

Fig. 2.
Effect of carvacrol combined with Dox on cell viability (A) and colony formation (B) of MDA-MB-231 cells.
A, treatment for 24 h s, data present mean ± SD (n = 3); B, left: Representative images of colony-forming assay (200×); right: Data present mean ± SD (n = 3). Groups 1-8: 1. Control; 2. Dox 1 μM; 3. Dox 1 μM + CA 100 μM; 4. Dox 1 μM + CA 150 μM; 5. Dox 1 μM + CA 200 μM; 6. CA 100 μM; 7. CA 150 μM; 8. CA 200 μM. Dox, doxorubicin; CA, carvacrol; ap <0.05 vs. Control (without treatment); bp <0.05 vs. Dox alone; cp < 0.05 vs. Dox 1 µM + CA 100 µM.
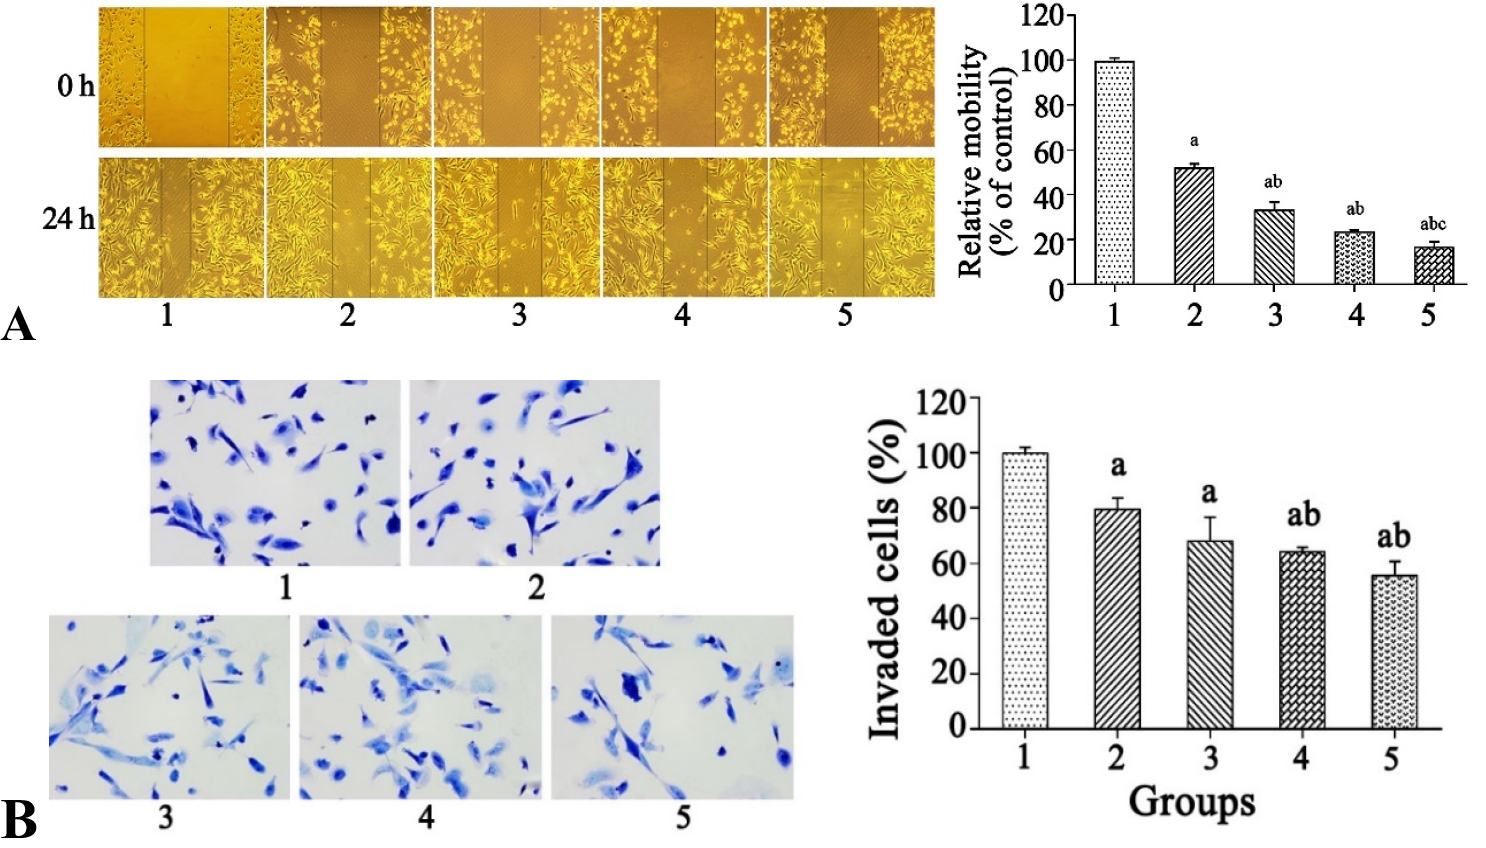
Fig. 3.
Inhibition of MDA-MB-231 cell migration by Dox and carvacrol co-treatment for 24 h assessed by wound healing assay (A) and Transwell invasion assay (B).
Notes: (A) Representative images of wound healing at 0 h and 24 h of Dox and carvacrol co-treatment (100×), Mobility percentage relative to the Control (cells without treatment); (B) Representative image of invaded cells (200×), quantitative analysis of invaded cells in three randomly selected fields; ap < 0.05 vs control; bp < 0.05 vs Dox alone, cp < 0.05 vs Dox 1µM + CA 100 µM. Dox, Doxorubicin; CA, carvacrol. Groups 1-5: 1. Control; 2. Dox 1 μM; 3. Dox 1 μM + CA 100 μM; 4. Dox 1 μM + CA 150 μM; 5. Dox 1 μM + CA 200 μM.
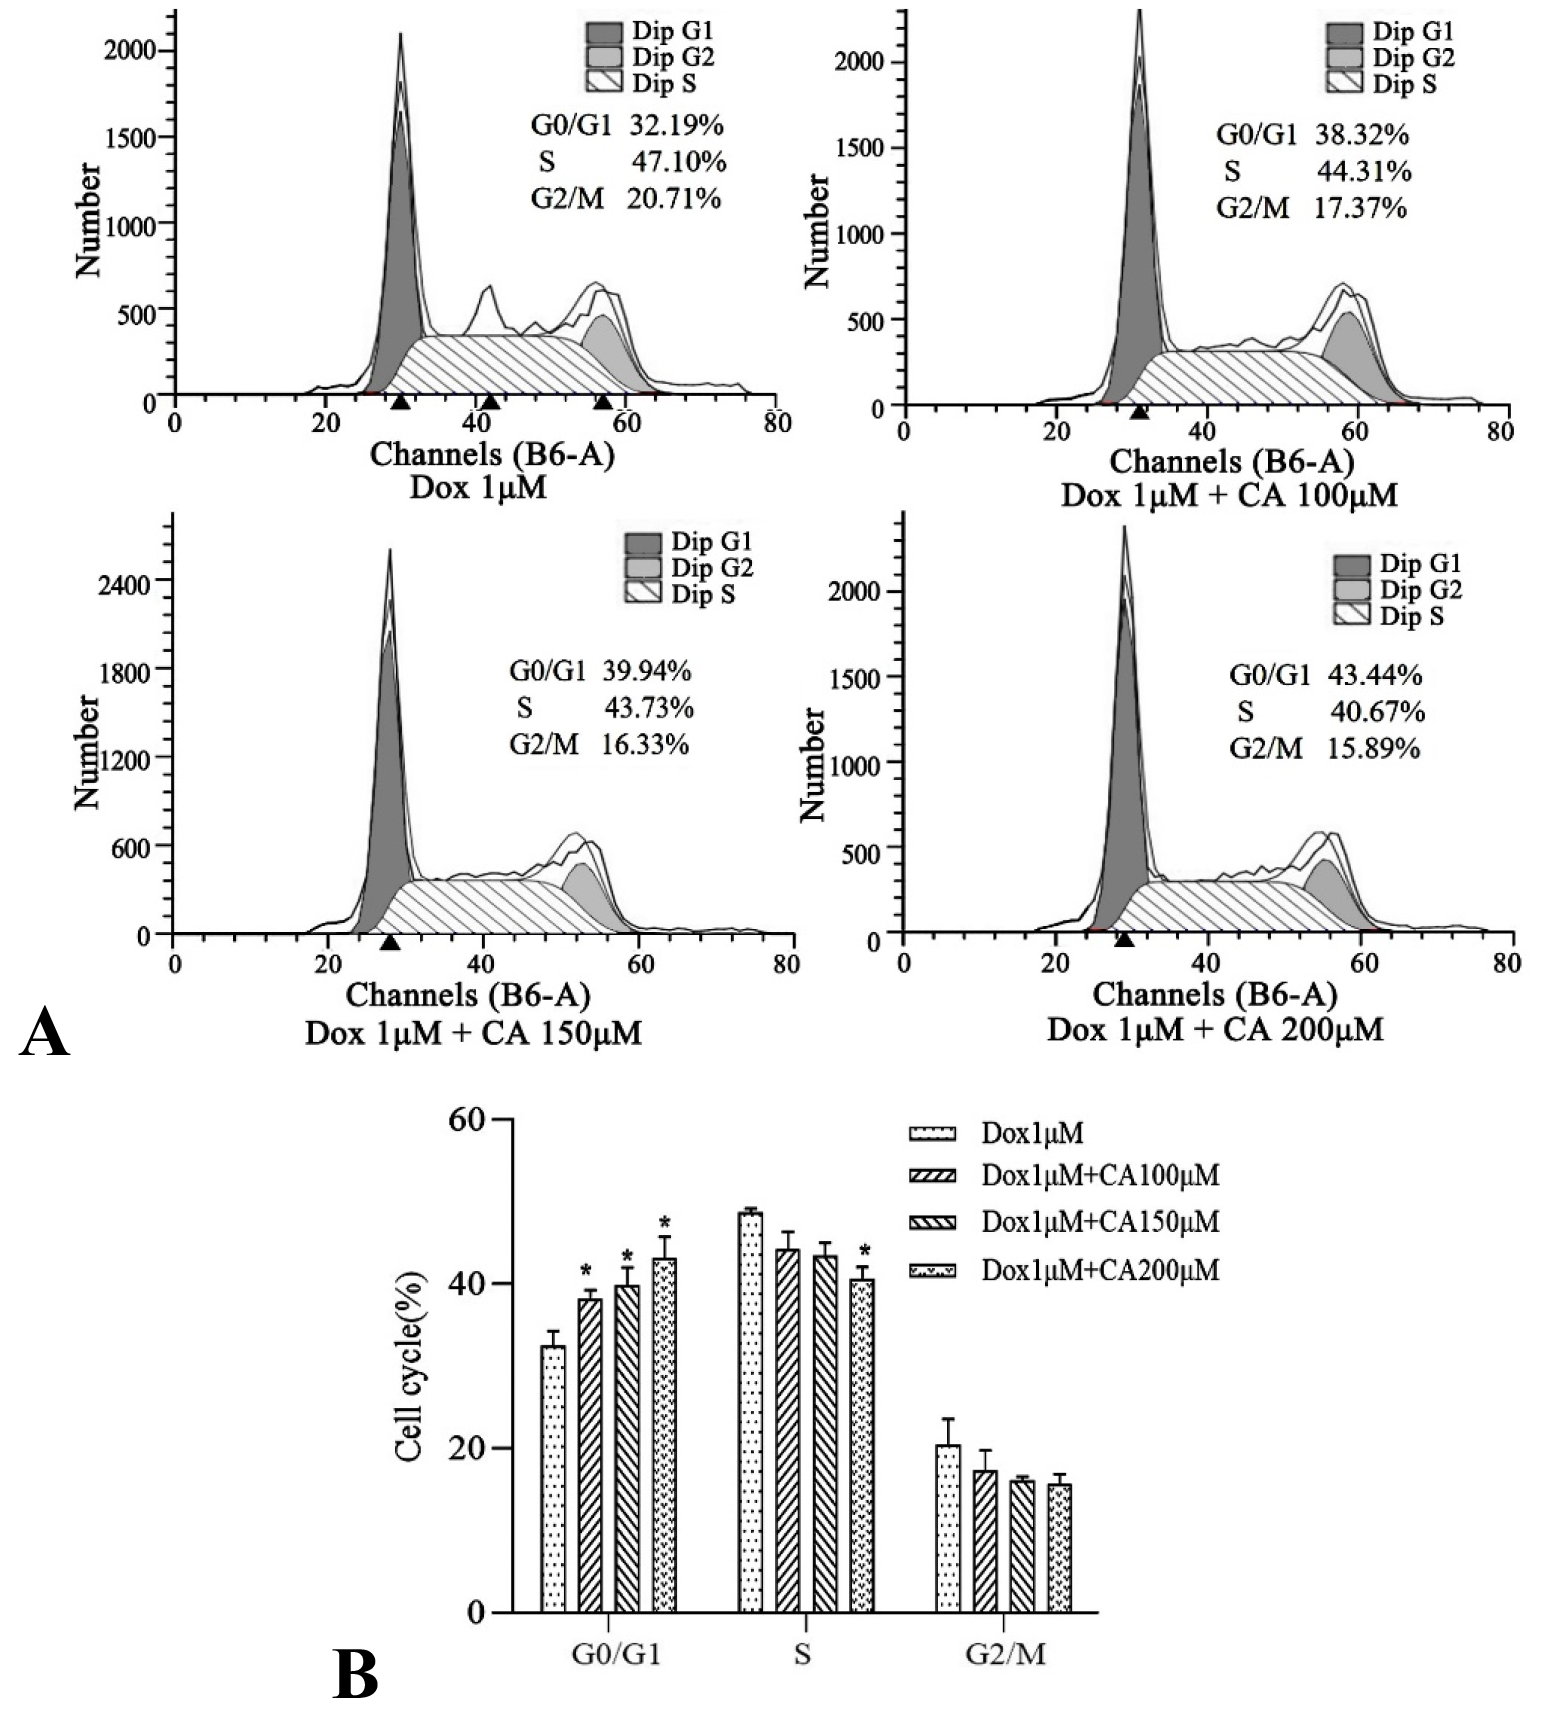
Fig. 4.
Carvacrol combined with Dox induce cell cycle arrest in MDA-MB-231 cells. After treatment for 24 h, cell cycle analysis was conducted by flow cytometry via propidium iodide staining. (A) Representative flow-cytometric profiles of cell cycle distribution. (B) Percentages of cells in each cell cycle phase.
Notes: Data are expressed as mean ± SD (n = 3); * p < 0.05 vs. Dox alone.

Fig. 5.
Apoptosis analysis of MDA-MB 231 cells after carvacrol and Dox co-treatment for 24 h. Cell apoptosis was stained with Annexin V and PI, and analyzed by flow cytometer. Data presented as mean ± SD (n = 3).
Notes: * p < 0.05, ** p < 0.01 vs. Dox alone.
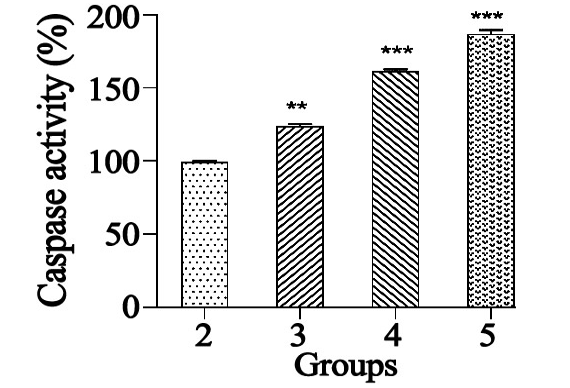
Fig. 6.
Dose-dependent activation of caspase-3 in carvacrol and Dox co-treated MDA-MB-231 cells. Caspase-3 activity in cells treated with different concentrations of carvacrol combined with Dox for 24 h determined by a Kit.
Note: ** p < 0.01, *** p < 0.001 *** vs. Dox alone; Groups 2-5: 2. Dox 1 μM; 3. Dox 1 μM + CA 100 μM; 4. Dox 1 μM + CA 150 μM; 5. Dox 1 μM + CA 200 μM.

Fig. 7.
Impact of carvacrol combined with Dox treatment on expression levels of cell apoptosis, migration and invasion-related proteins in MDA-MB-231 cells.
Notes: Bcl-2, Bax, MMP-2, and MMP-9 protein expression levels after 48 h exposure were determined by Western blot. GAPDH was used as a loading control; * p < 0.05, ** p < 0.01, *** p < 0.001 vs. Dox alone.

November 2024
Pakistan J. Zool., Vol. 56
