

Identification and Verification of Hub mRNA-miRNA-lncRNA Network on Psoriasis by Integrated Bioinformatics Analysis


Identification and Verification of Hub mRNA-miRNA-lncRNA Network on Psoriasis by Integrated Bioinformatics Analysis
Wen-Da Wang1, Wei-Yue Gong1, Bin Li2, Shan-Shan Lei3* and Qing-Hua Wang1*
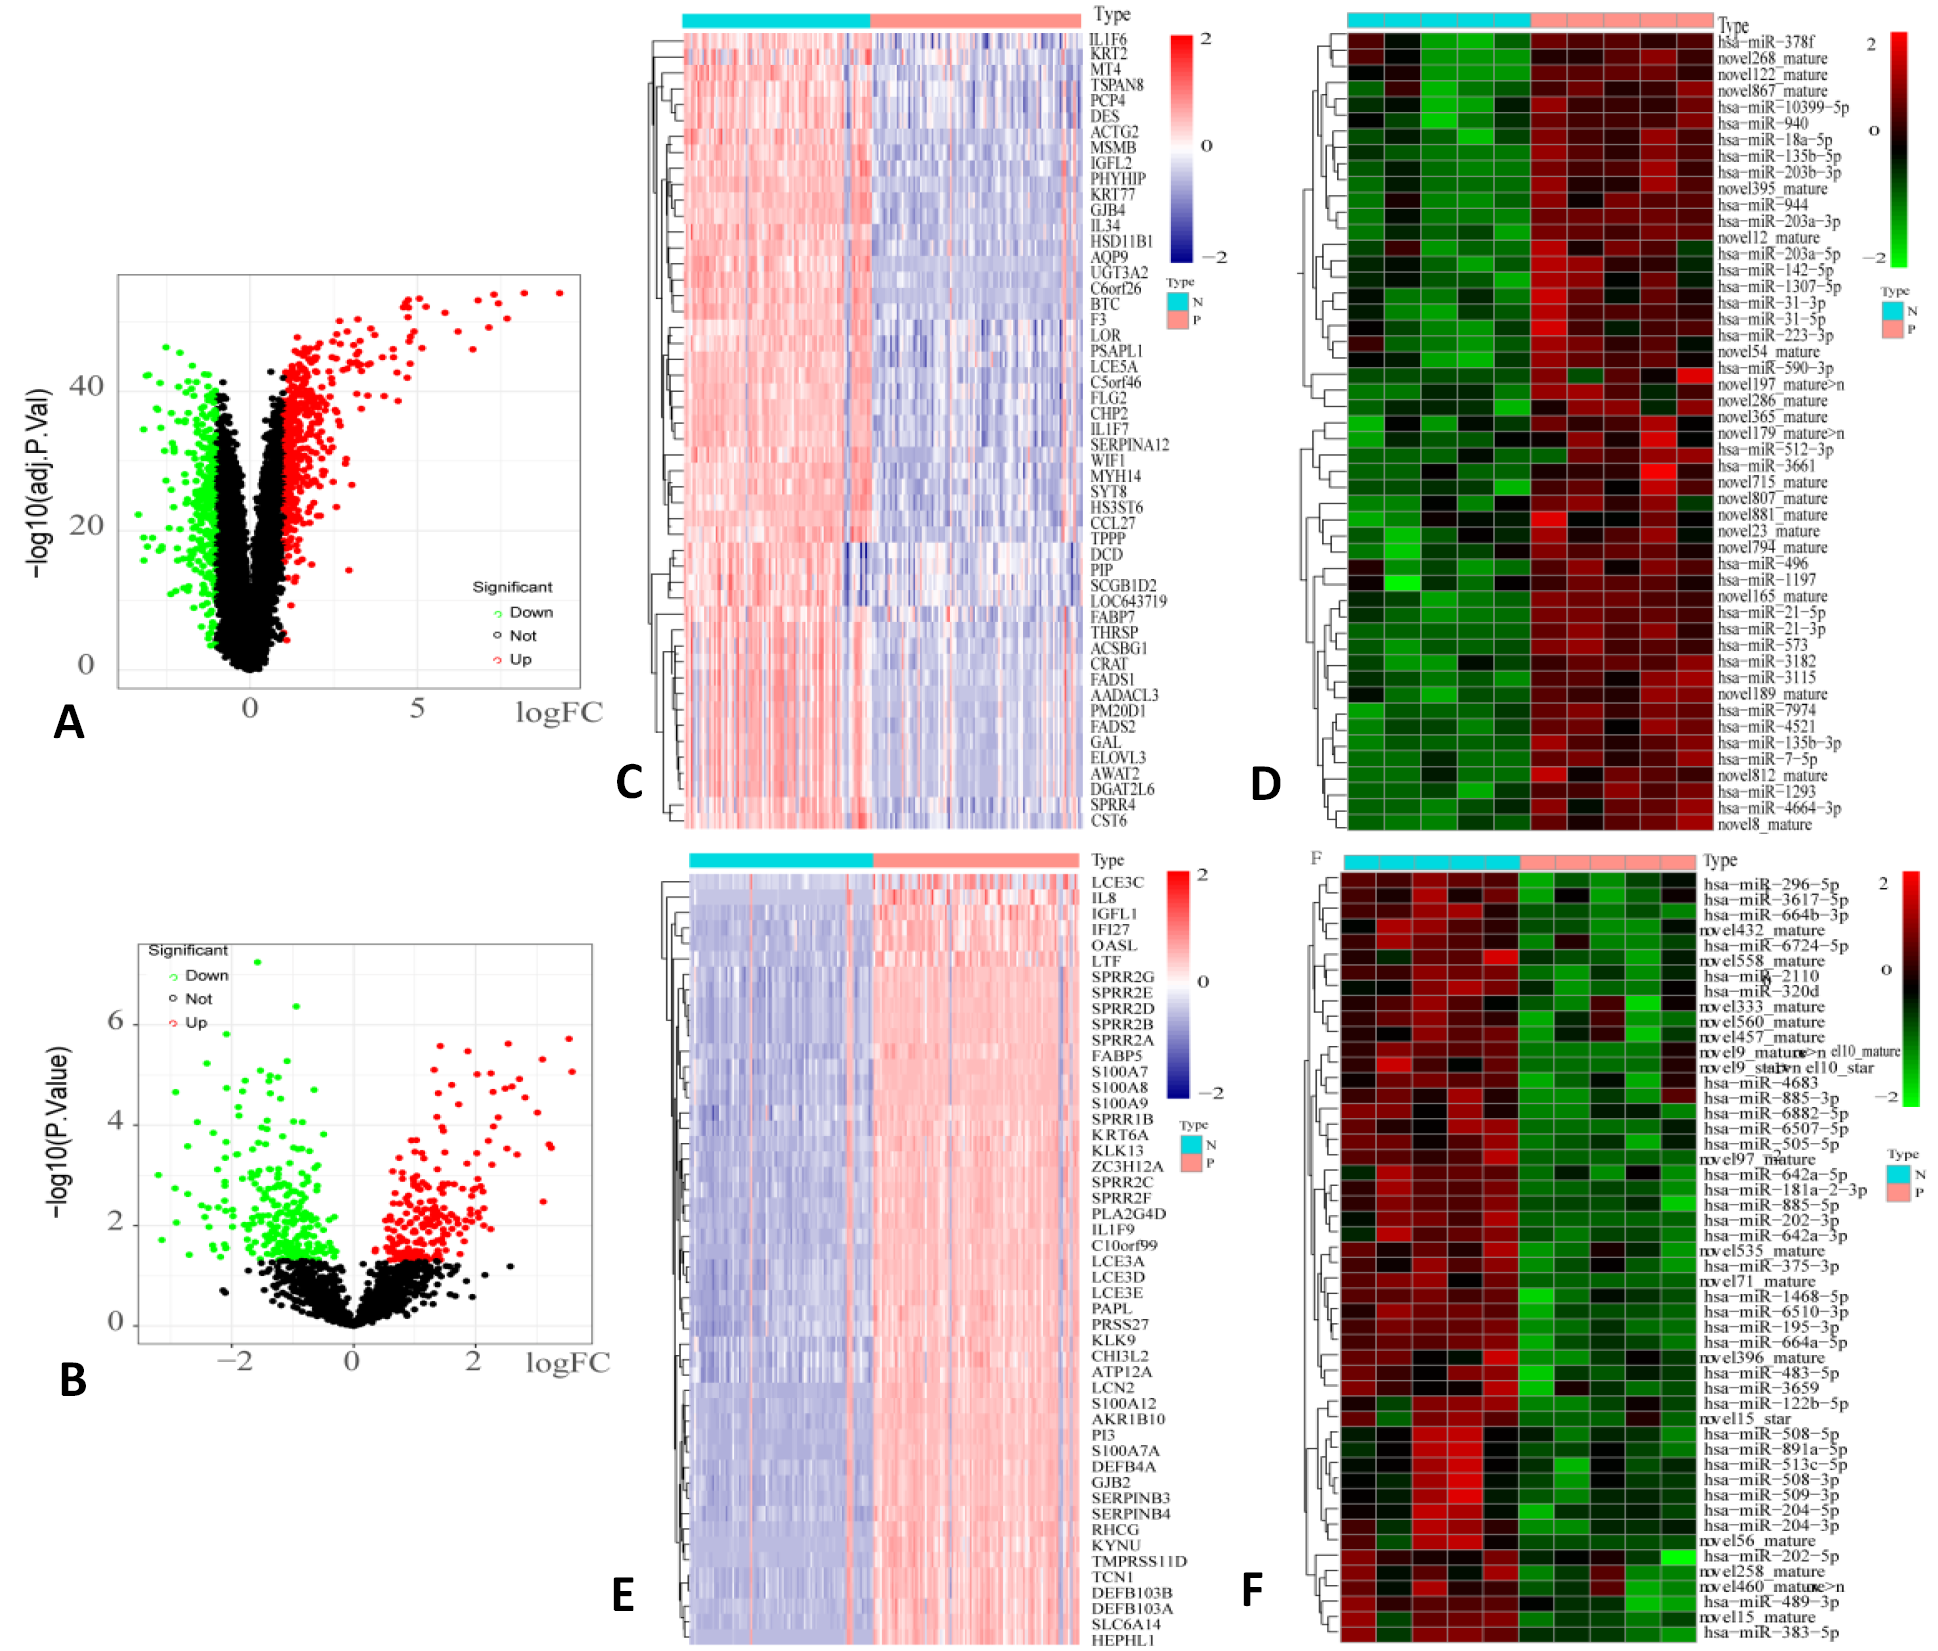
DEmRNAs and DEmiRNAs between skin lesion samples and normal controls. The volcano plots show significant DEmRNAs in GSE54456 (A) and significant DEmiRNAs in GSE142582 (B). Heat maps show significant up-regulated DEmRNAs (C), down-regulated DEmiRNAs (D), down-regulated DEmRNAs (E) and up-regulated DEmiRNAs (F). Type of N indicates normal controls, and type of P indicates skin lesion samples. In panels (C, E), blue represents down-regulated DEmRNA and pink represents up-regulated DEmRNA; in panels (D,F), green represents down-regulated DEmiRNA and red represents up-regulated DEmiRNA.
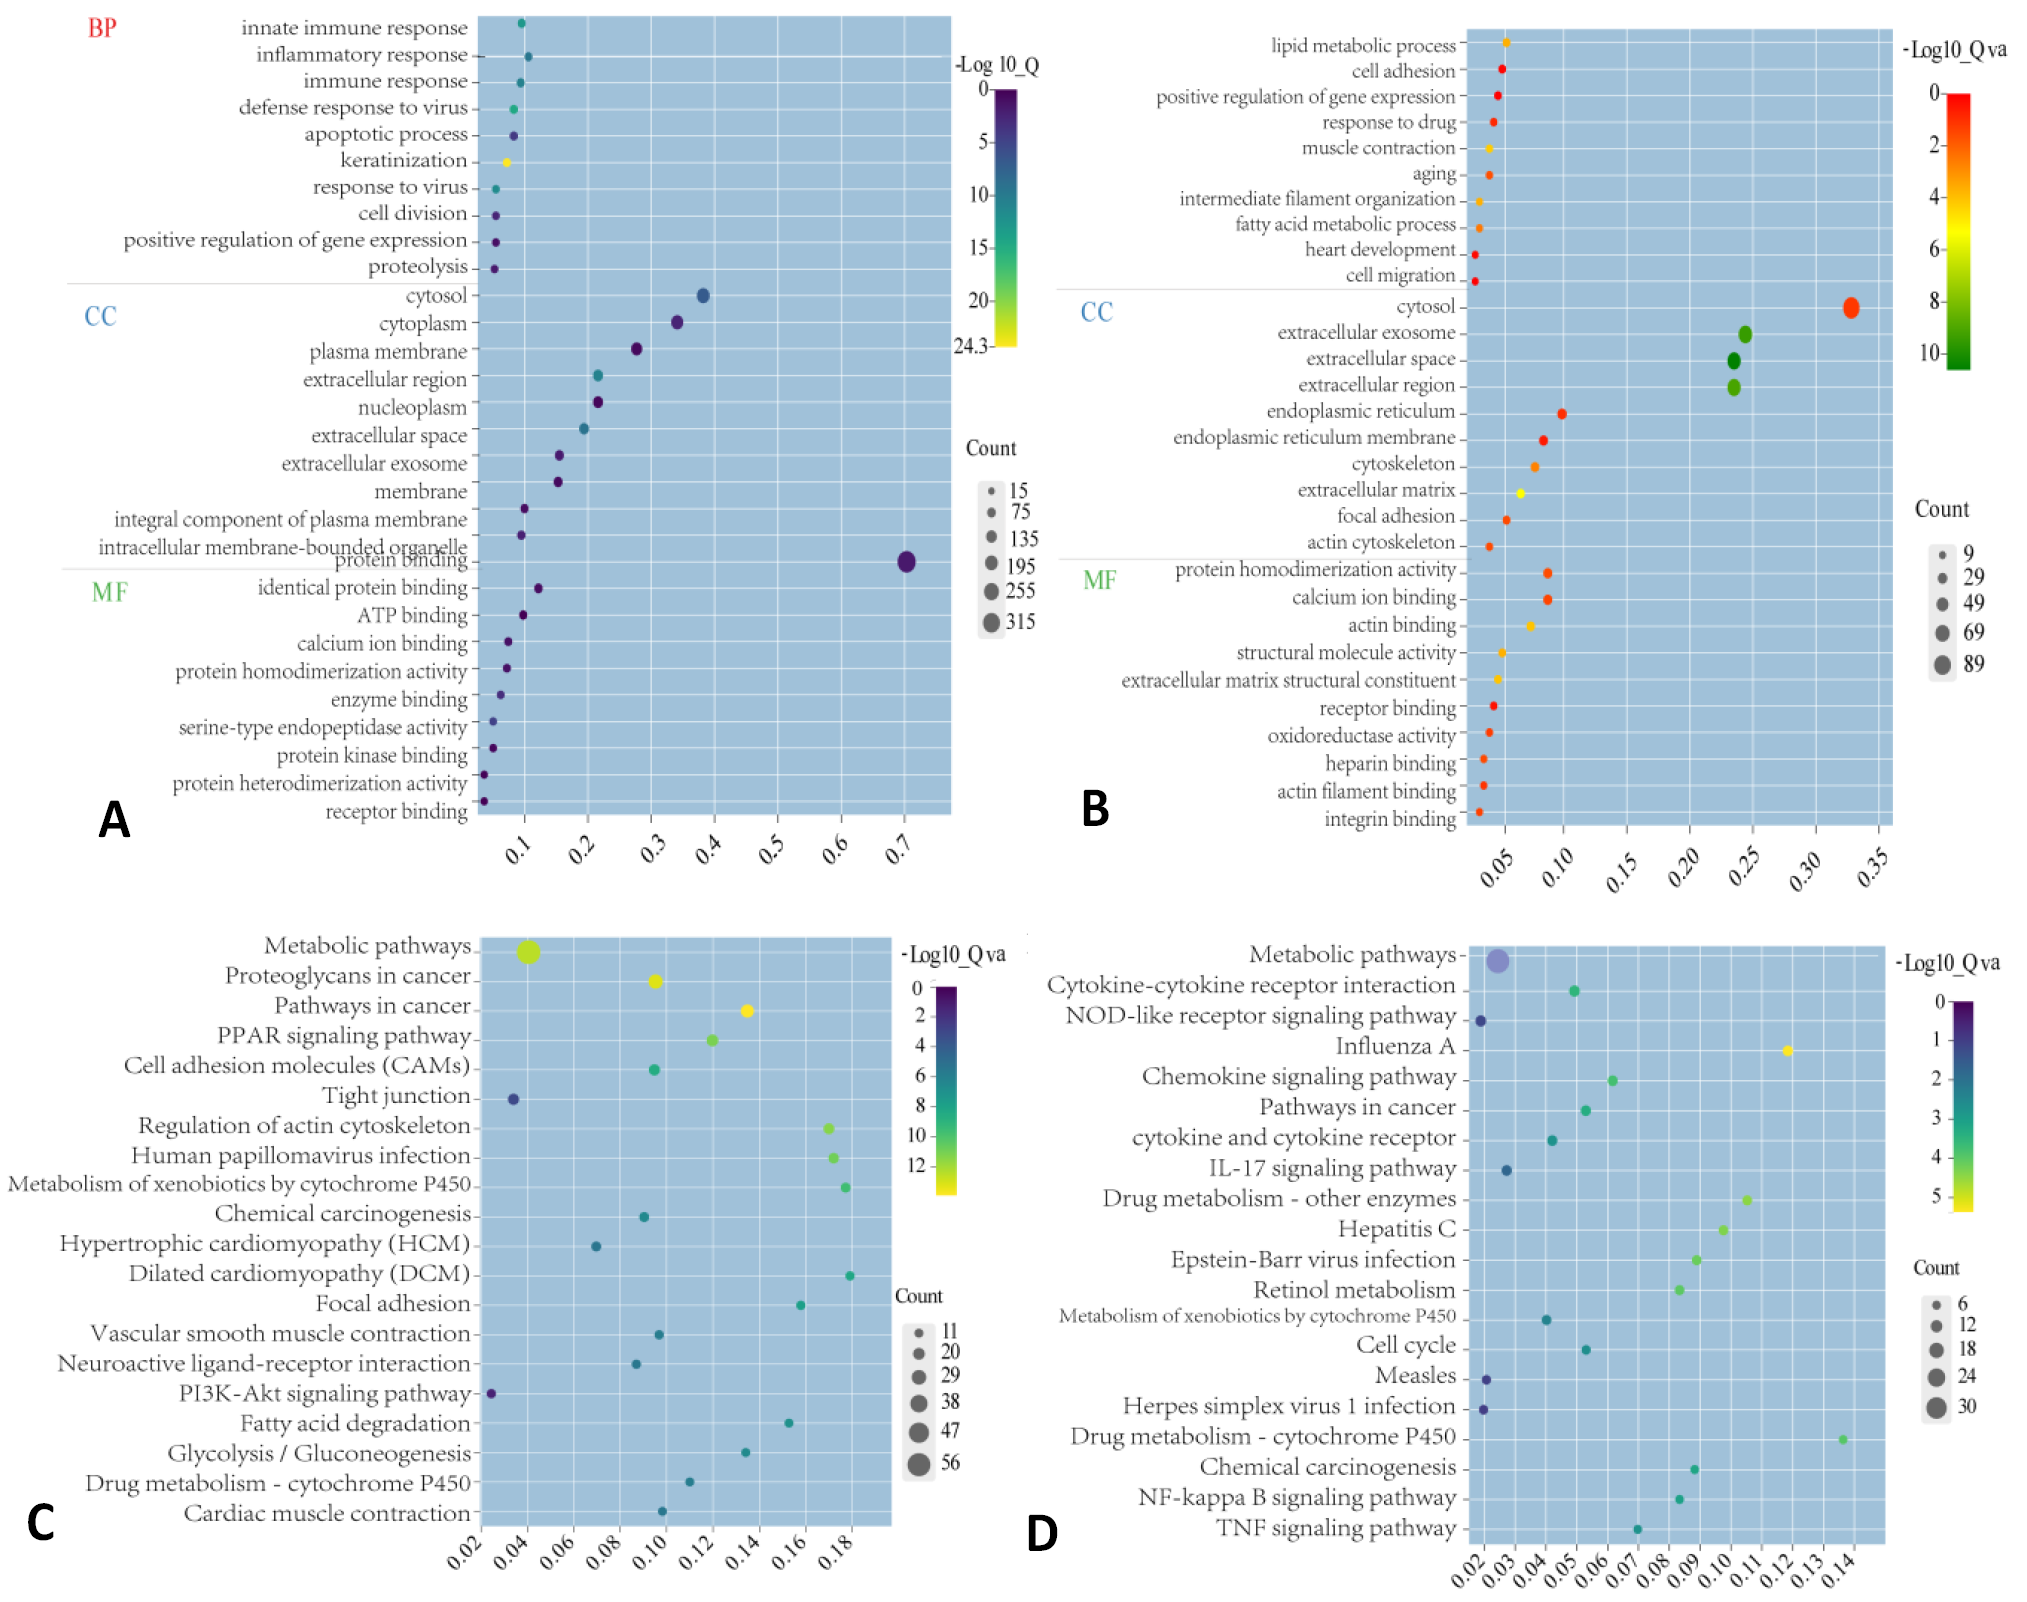
GO and KEGG analyses for significant DEmRNAs in GSE54456. The bubble charts show GO analysis results of up-regulated (A) and down-regulated DEmRNAs (B), and KEGG analysis results of up-regulated (C) and down-regulated DEmRNAs (D).
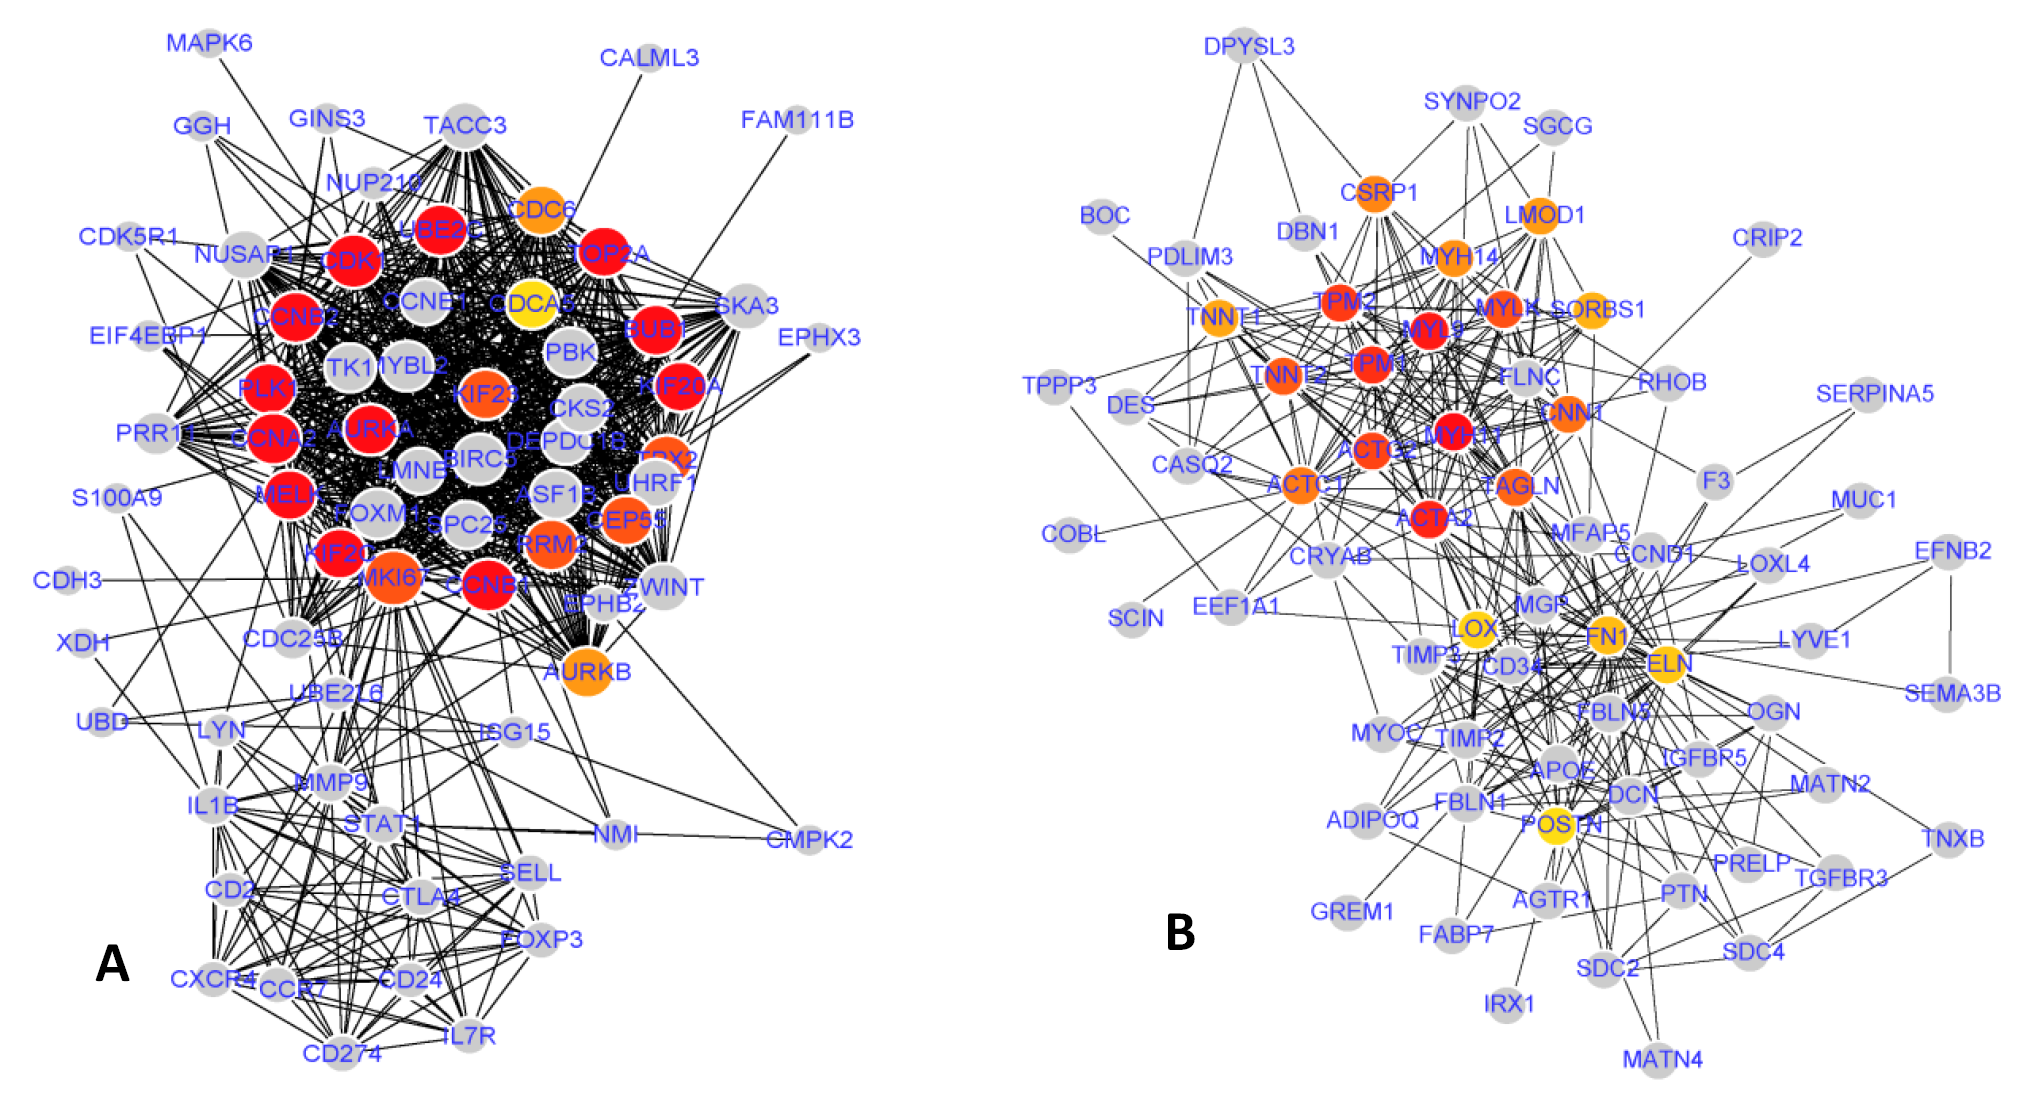
Protein-protein interaction (PPI) network. (A) up-regulated hub genes network. (B) down-regulated hub genes network. Gray nodes represent hub genes, while lines illustrate the relationship between nodes. Red nodes indicate the top ten hub genes ranked by degree.

The lncRNA-miRNA-mRNA regulatory network. (A) The network of lncRNAs, down-regulated miRNAs, and up-regulated hub genes. (B) The network of lncRNAs, up-regulated miRNAs, and down-regulated hub genes. Yellow nodes represent lncRNA, green nodes represent miRNA, and red nodes represent mRNAs.
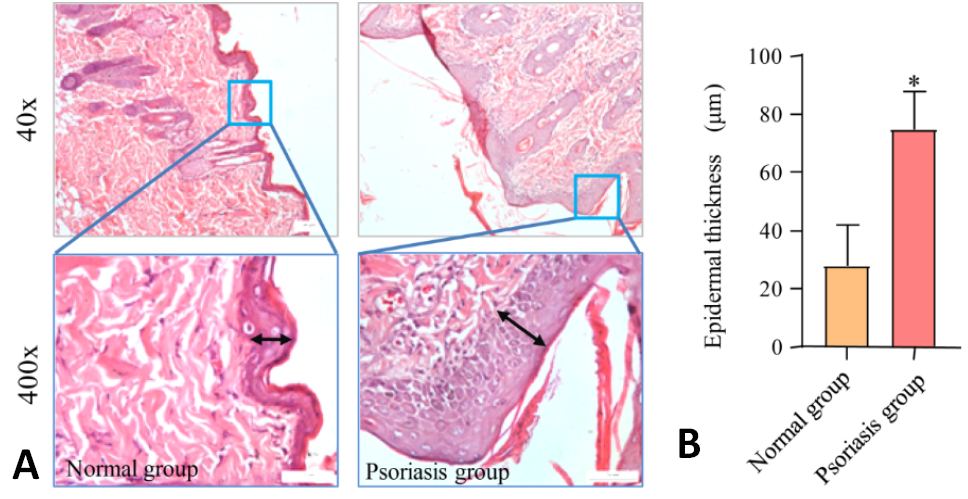
Histopathology of skin tissues in psoriasis rats. (A) H&E staining of rat skin tissue (40× & 400×). (B) Statistical graph of epidermal thickness of skin. Data are presented as mean ± SD. * p <0.05, compared to Normal group.
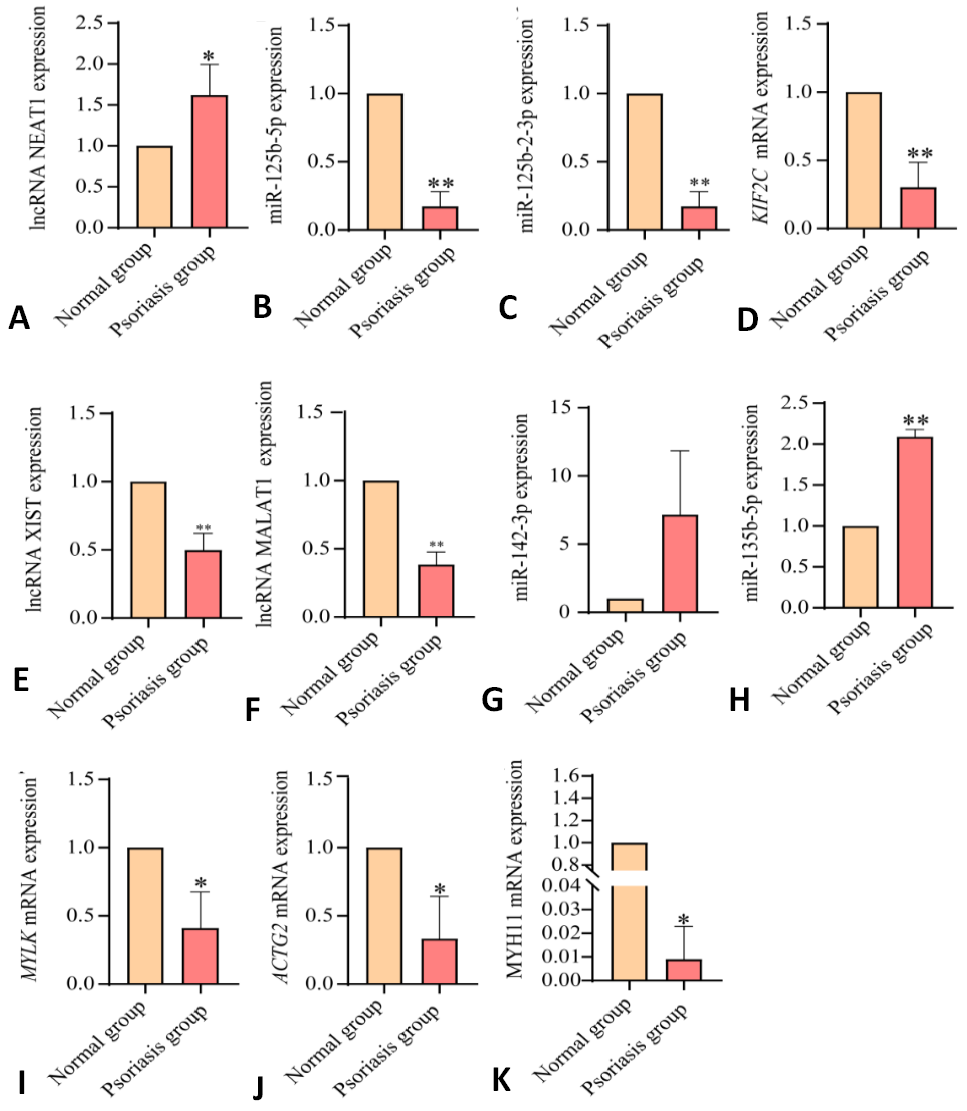
Differential expression analysis of the hub lncRNA-miRNA-miRNA regulatory network. * p <0.05, ** p <0.01, vs. the normal group.

