
Impact of Defaunation on Physical Examination, Bodyweight, Feed Intake and Rumen Protozoal, Biochemical and Histo-Anatomical Compositions in Native-breed Goats


Impact of Defaunation on Physical Examination, Bodyweight, Feed Intake and Rumen Protozoal, Biochemical and Histo-Anatomical Compositions in Native-breed Goats
Mahmoud Saber1, Sabry A. Mousa2, Hisham A. Abdelrahman3, Eman Rashad4, Ramadan Sary5, Meray N. Ramsis5*
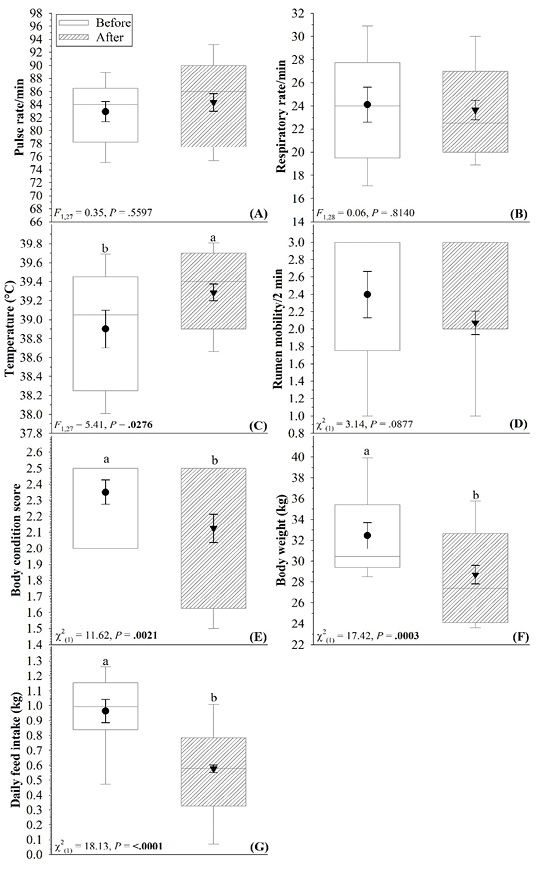
Comparisons between values of physical examination parameters measured in goats before and after defaunation. Within each box plot, vertical line indicates median, black symbol indicates mean, and error bars represent standard error of mean. Within the same parameter, data with different lowercase letters differ significantly between before and after defaunation at p < .05 if bold.
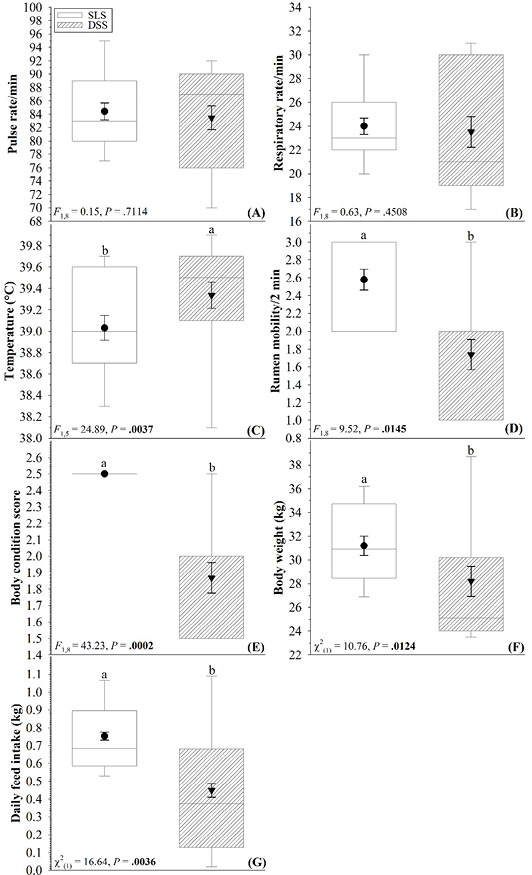
Comparisons between effects of two defaunating agents (sodium lauryl sulfate [SLS] and dioctyl sodium sulphosuccinate [DSS]) on values of different physical examination parameters measured in goats. Within each box plot, vertical line indicates median, black symbol indicates mean, and error bars represent standard error of mean. Within the same parameter, data with different lowercase letters differ significantly between defaunating agents at p < .05 if bold.
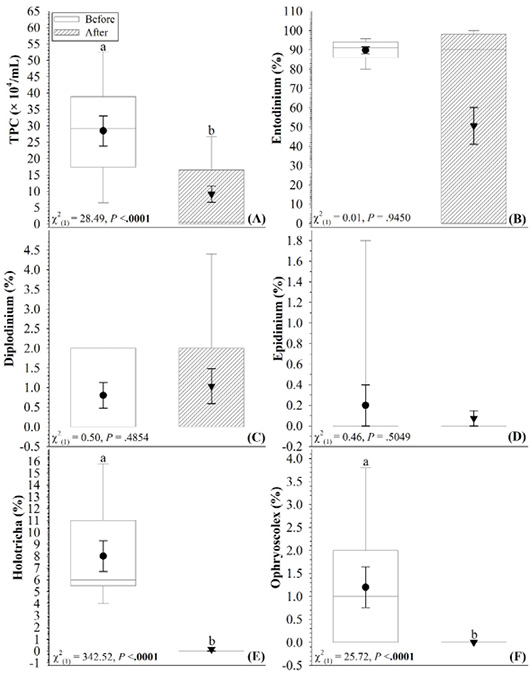
Comparisons between values of different rumen protozoa examined in goats before and after defaunation. Within each box plot, vertical line indicates median, black symbol indicates mean, and error bars represent standard error of mean. Within the same parameter, data with different lowercase letters differ significantly between before and after defaunation at p < .05 if bold.
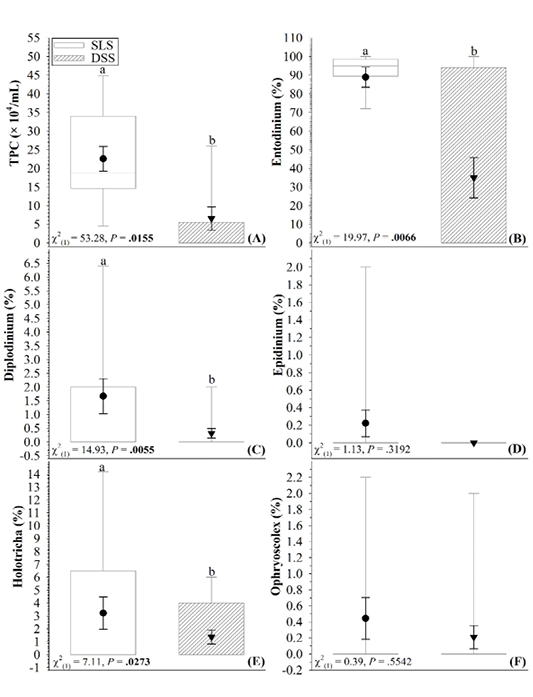
Comparisons between effects of two defaunating agents (sodium lauryl sulfate [SLS] and dioctyl sodium sulphosuccinate [DSS]) on values of different rumen protozoa examined in goats. Within each box plot, vertical line indicates median, black symbol indicates mean, and error bars represent standard error of mean. Within the same parameter, data with different lowercase letters differ significantly between defaunating agents at p < .05 if bold.
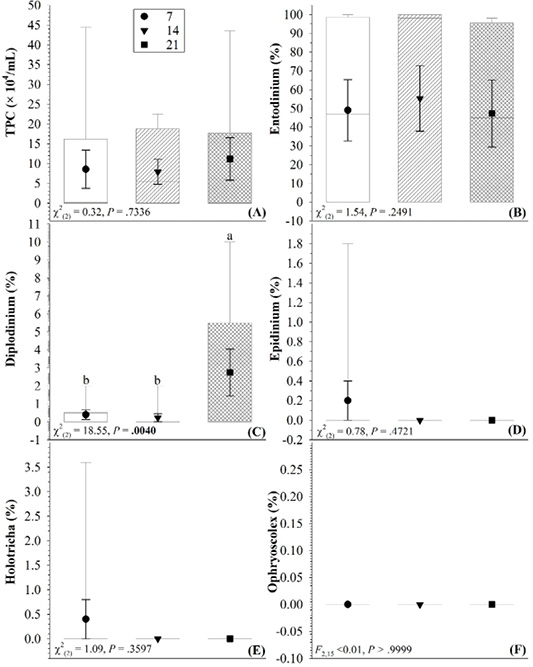
Effect of days after defaunation (7, 14, and 21 days) on different rumen protozoa examined in goats. Within each box plot, vertical line indicates median, black symbol indicates mean, and error bars represent standard error of mean. Within the same parameter, data with different lowercase letters differ significantly among days after defaunation at p < .05 if bold.
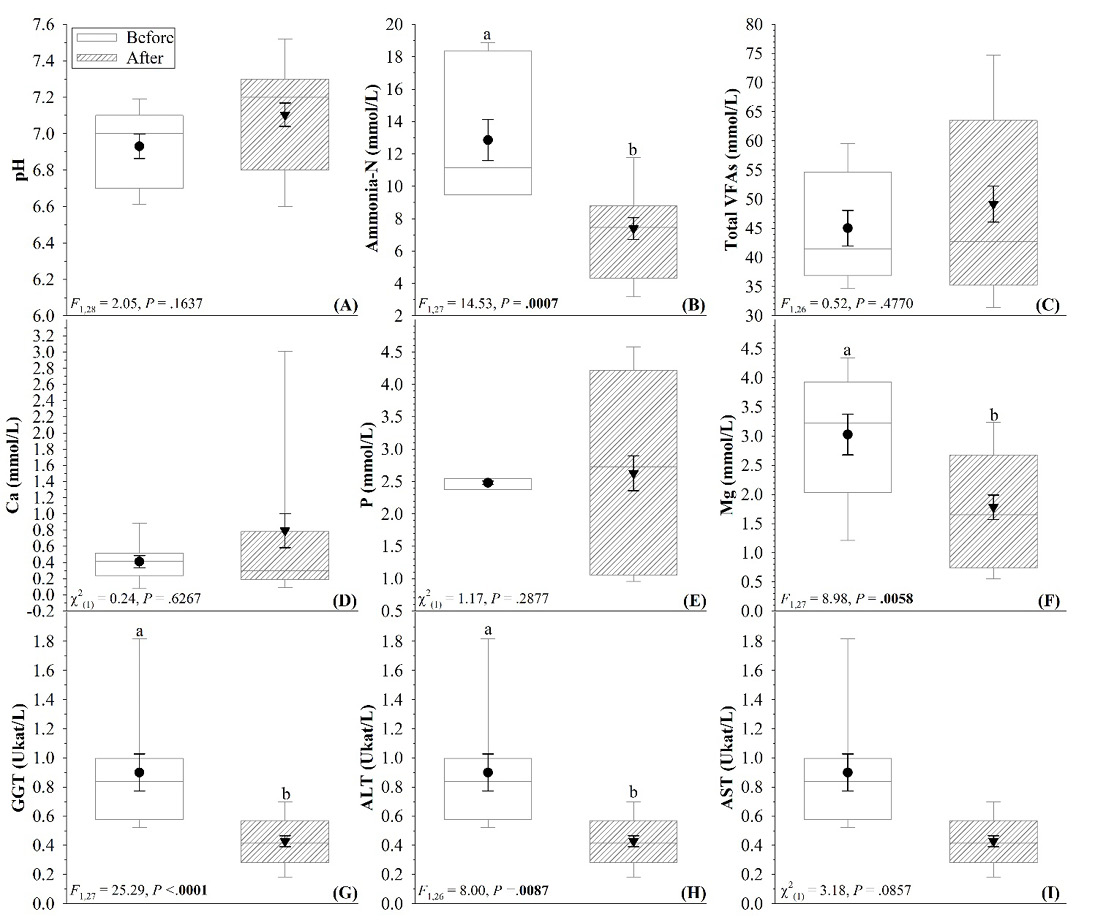
Comparisons between values of rumen biochemistry parameters determined in goats before and after defaunation. Within each box plot, vertical line indicates median, black symbol indicates mean, and error bars represent standard error of mean. Within the same parameter, data with different lowercase letters differ significantly between before and after defaunation at p < .05 if bold.
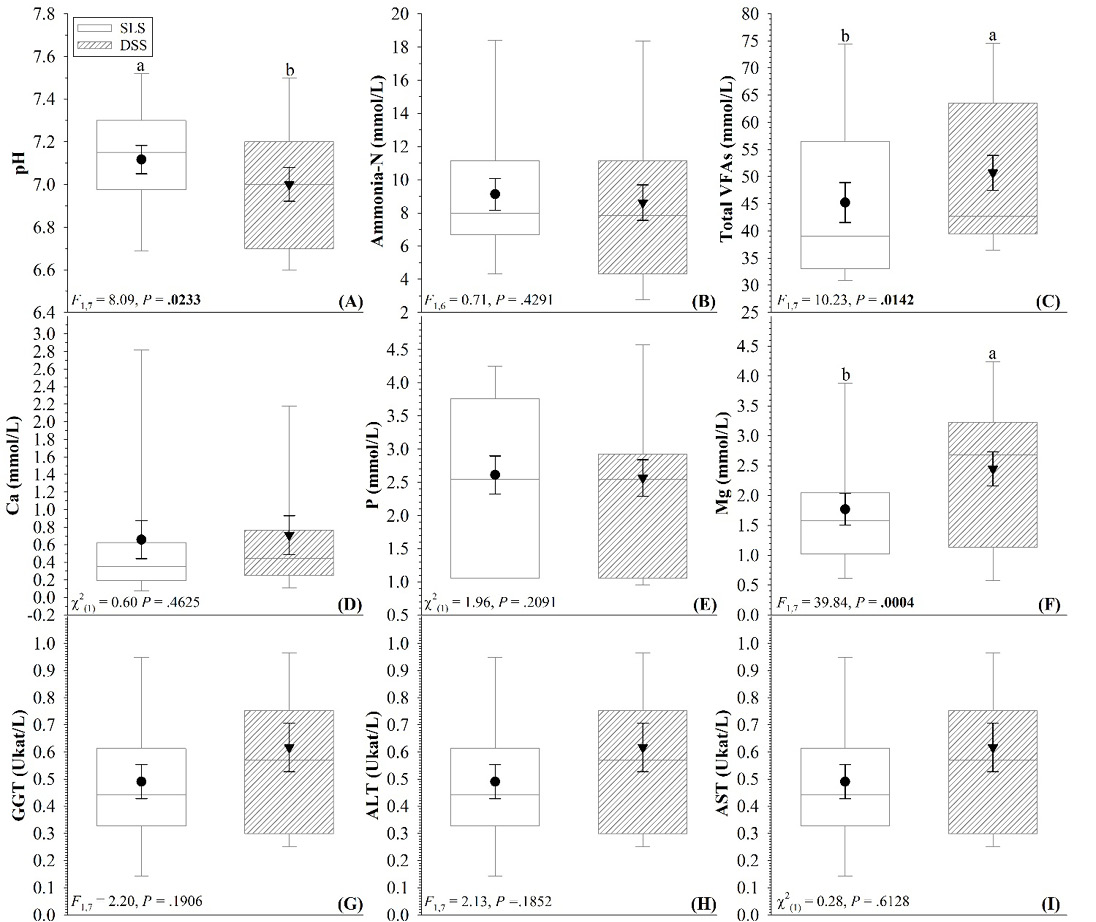
Comparisons between effects of two defaunating agents (sodium lauryl sulfate [SLS] and dioctyl sodium sulphosuccinate [DSS]) on values of rumen biochemistry parameters determined in goats. Within each box plot, vertical line indicates median, black symbol indicates mean, and error bars represent standard error of mean. Within the same parameter, data with different lowercase letters differ significantly between defaunating agents at p < .05 if bold.

Effect of days after defaunation (7, 14, and 21 days) on rumen biochemistry parameters determined in goats. Within each box plot, vertical line indicates median, black symbol indicates mean, and error bars represent standard error of mean. Within the same parameter, data with different lowercase letters differ significantly among days after defaunation at p < .05 if bold.
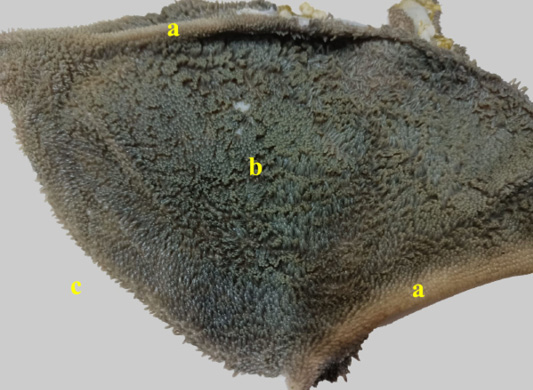
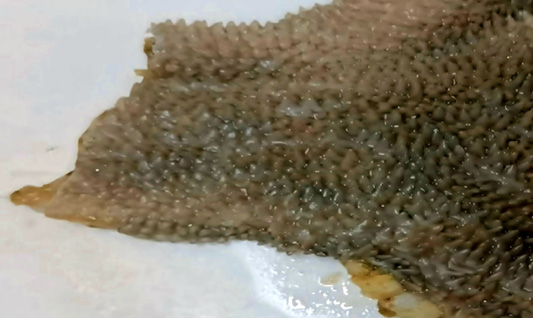
Photograph showing the normal thickness of ruminal papillae in goat.

Photograph showing the normal length of ruminal papillae in goat.
Photograph showing the effect of SLS (sodium Lauryl sulfate) on ruminal papillae and ruminal pillar.
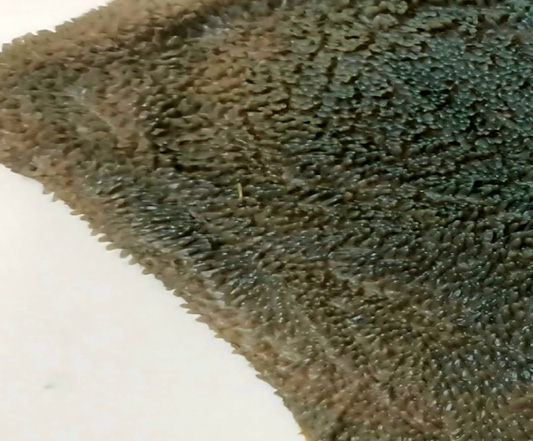
Photograph showing the effect of photograph showing the effect of DOSS (Dioctyl sodium sulphosuccinate) on ruminal papillae and ruminal pillar.
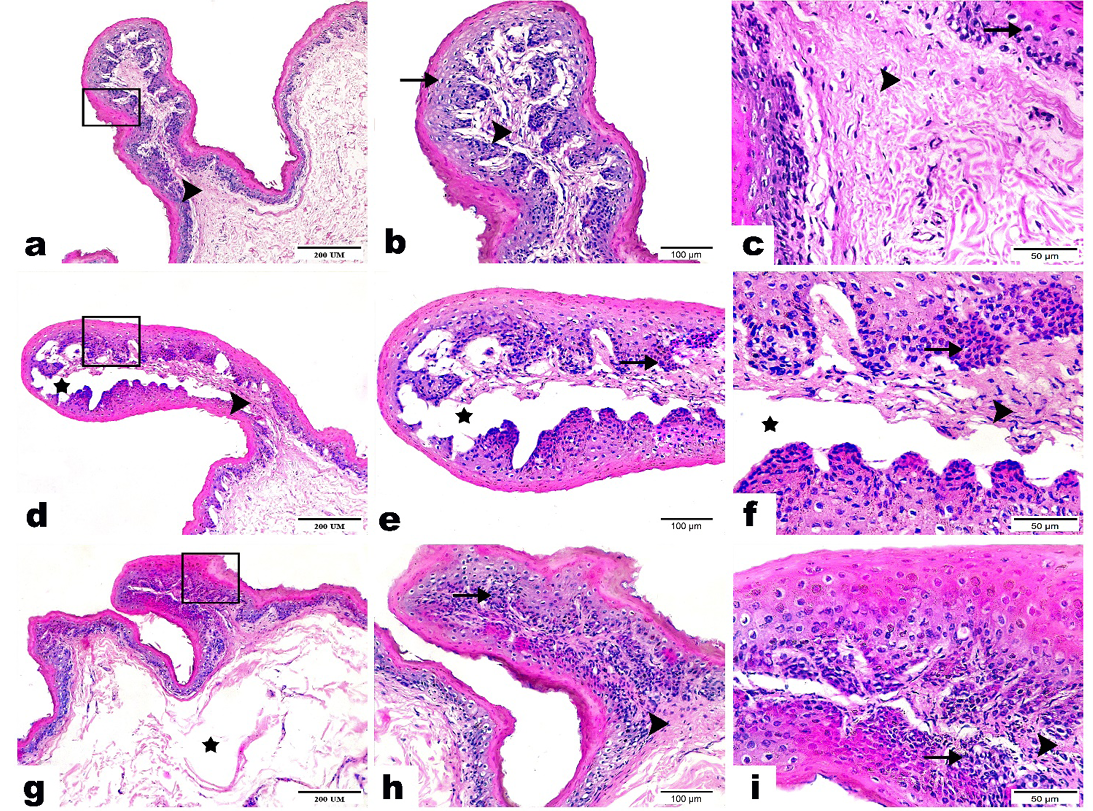
Photomicrographs displayed the histopathological variations of rumen tissue sections between examined groups as follows: (a, b, c) Control Group demonstrated the standard histological structure of tunica mucosa (rectangle) in its stratified squamous keratinized epithelium (arrow) and propria sub mucosal layer (arrowhead). (d, e, f) Doss Group: revealed hyperplasia of the lining epithelium (rectangle), inflammatory cells (arrow), increase in fibrous amount (arrowhead), as well as interstitial edema (star). (g, h, i) SLS Group: highlighted hyperkeratosis along with hyperplasia in the lining epithelium (rectangle), inflammatory cells (arrow) and increase in the fiber amount (arrowhead). (H&E, Magnification power: x100, x200, x400, respectively).
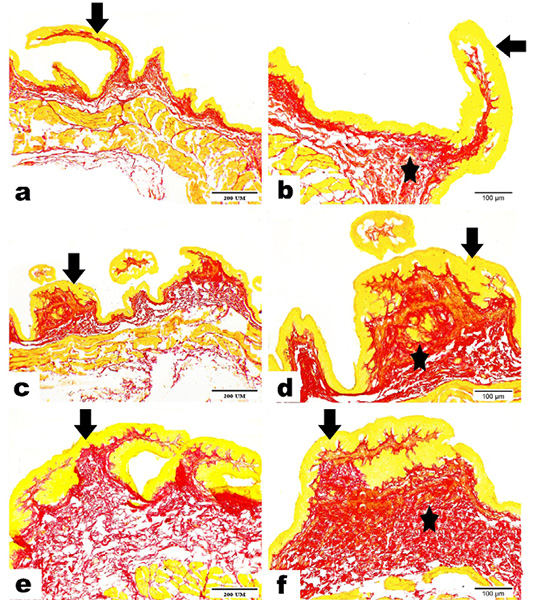
Photomicrographs exposing the impact of DOSS and SLS on collagen deposition in rumen tissues as follows: (a, b, c) Control Group displaying normal epithelium (arrow) and a few amounts of collagen fibers (star). (d, e, f) DOSS Group: demonstrated hyperplasia of epithelium (arrow) as well as moderate deposition of collagen fibers (star). (g, h, i) SLS Group: highlighted epithelium with intense hyperkeratosis and hyperplasia (arrow), as well as extreme proliferative collagen fibers (star). Collagen fibers were labelled in red, while non-collagen proteins were marked in orange. (Sirius Red, Magnification power: x100, x200).
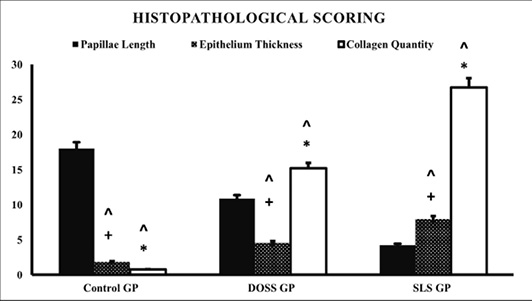
Bar graph reflecting % area of collagen fibers; n = 6. Values were expressed as means ± SD. Significant difference was presented at p<0.001; using One-way ANOVA followed by Tukey’s Honestly Significant Difference (HSD) post-hoc.
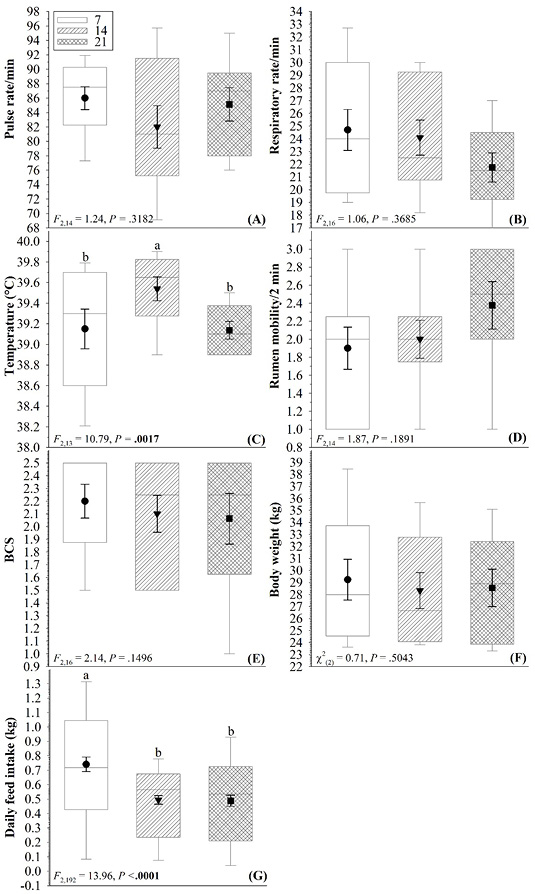
Effect of days after defaunation (7, 14, and 21 days) on different physical examination parameters measured in goats. Within each box plot, vertical line indicates median, black symbol indicates mean, and error bars represent standard error of mean. Within the same parameter, data with different lowercase letters differ significantly among days after defaunation at p < .05 if bold.

