
Metabolomics of Periparturient Holstein-Friesian Cows Associated with Feeding a Negative Dietary Cation-Anion Difference (DCAD)


Metabolomics of Periparturient Holstein-Friesian Cows Associated with Feeding a Negative Dietary Cation-Anion Difference (DCAD)
Asaad A. Fares1*, Mohamed M. Ghanem2, Yasein M. Abd El-Raof2, Hossam M. El-Attar2, Ameer A. Megahed2, Heba M. El-Khaiat2
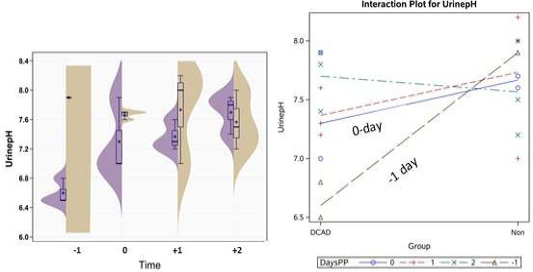
A diagram showing Urine pH for DCAD and NON-DCAD of Holstein- Friesian cattle. There is significant reduction in urine pH at group fed acidogenic diet.
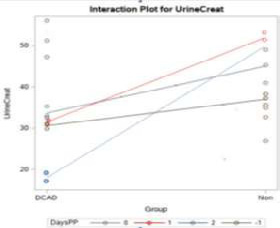
Urine Creat concentration for DCAD and NON-DCAD of Holstein- Friesian cattle.
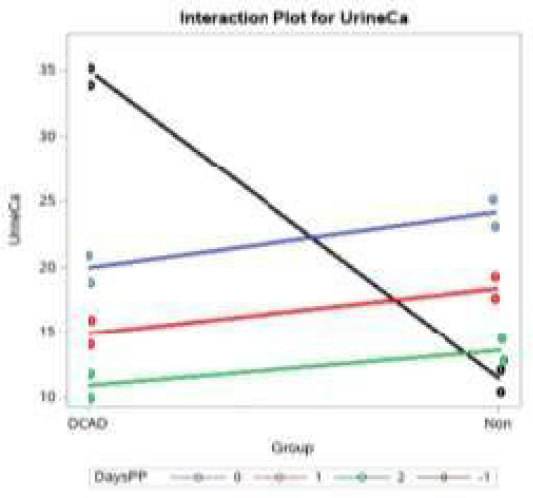
Urine Ca concentration for DCAD and NON-DCAD of Holstein- Friesian cattle.
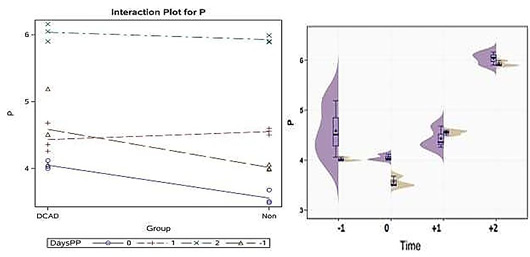
Serum phosphorus concentration for DCAD and NON-DCAD of Holstein- Friesian cattle.
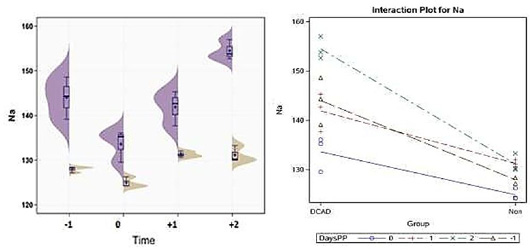
Serum Na concentration for DCAD and NON-DCAD of Holstein- Friesian cattle.
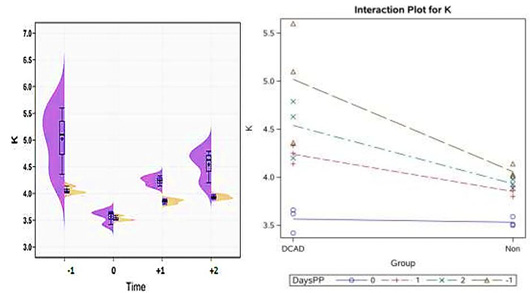
Serum potassium concentration for DCAD and NON-DCAD of Holstein- Friesian cattle.
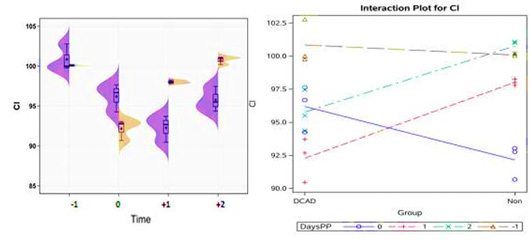
Serum Chlorid Concentration for DCAD and NON-DCAD of Holstein- Friesian cattle.
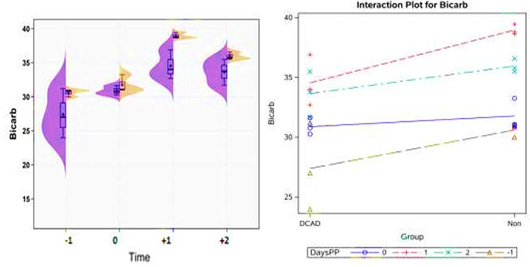
Serum bicarbonate concentration for DCAD and NON-DCAD of Holstein- Friesian cattle.
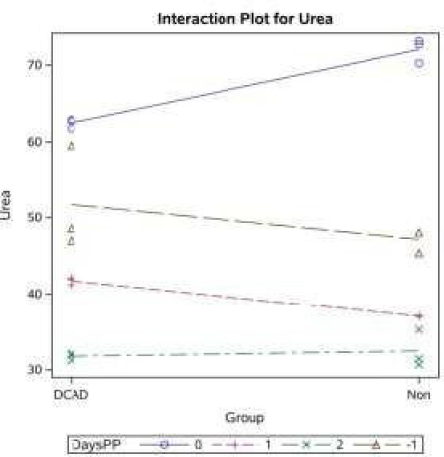
Serum urea concentration for DCAD and NON-DCAD of Holstein- Friesian cattle.
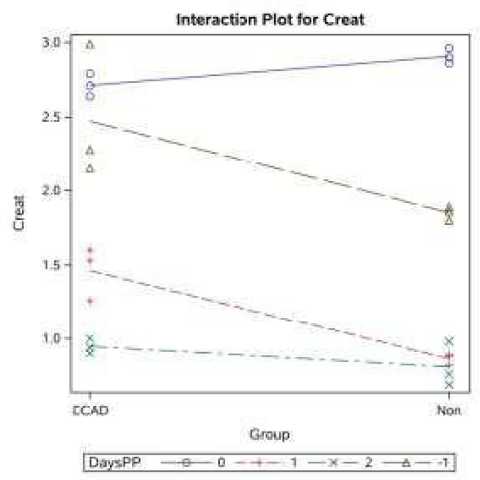
Serum creatinine concentration for DCAD and non-DCAD of Holstein- Friesian cattle, showing significant increase in DCAD group group compared to non-DCAD group at -1 day.
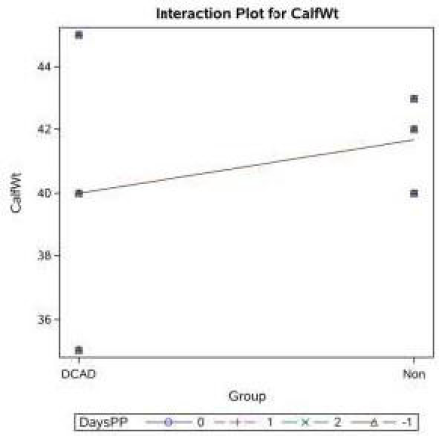
Calf Wt for DCAD and NON-DCAD of Holstein- Friesian cattle, showing non-significant change.
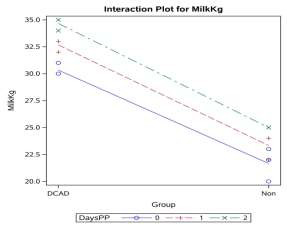
Milk kg for DCAD and NON-DCAD of Holstein- Friesian cattle, showing significant increase in milk production in DCAD group.
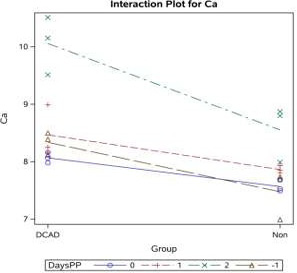
Serum Ca for DCAD and NON-DCAD of Holstein- Friesian cattle. DCAD increases the level of Ca, compared to non-DCAD group.
