

MicroRNAs hsa-miR-222-3p, hsa-let-7b-5p, and hsa-let-7f-5p Regulate Their Putative Target Genes HMGA1 and CDKN1B in Pakistani Breast Cancer Patients


MicroRNAs hsa-miR-222-3p, hsa-let-7b-5p, and hsa-let-7f-5p Regulate Their Putative Target Genes HMGA1 and CDKN1B in Pakistani Breast Cancer Patients
Hafiz Muhammad Farooq Yaqub1, Ali Raza Awan1, Rashid Saif2,3, Sehrish Firyal1, Muhammad Tayyab1, Muti-ur-Rehman Khan4 and Muhammad Wasim1*
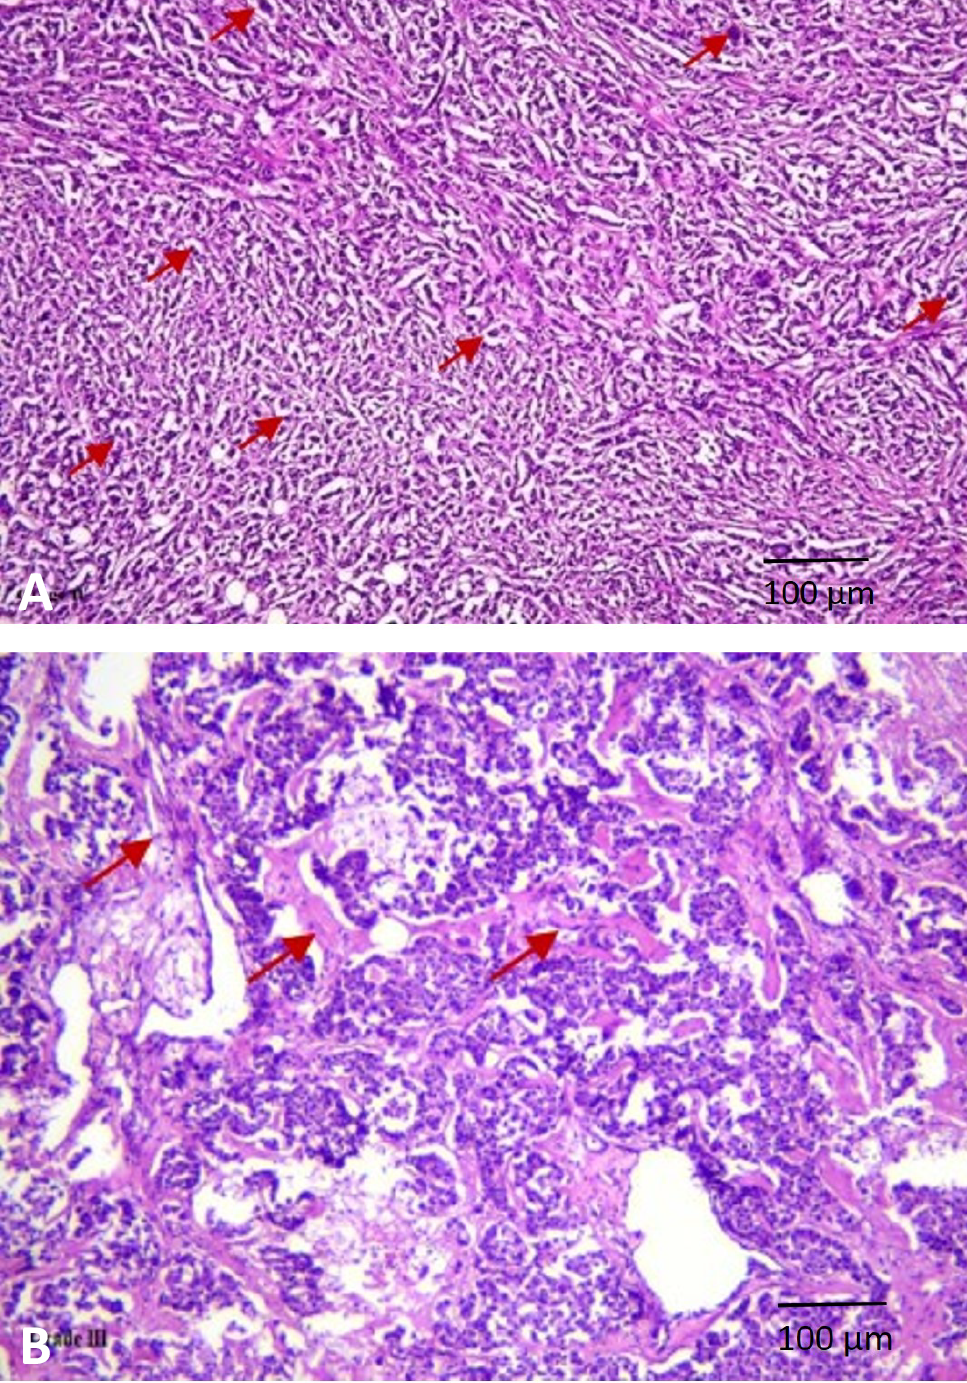
Histopathological analysis of human mammary tumor. (A) Representative human mammary tumor showed varied population of cells with enormous nucleus and prominent mitotic characteristic. (B) Numerous key regions indicating the presence of fibroblasts.
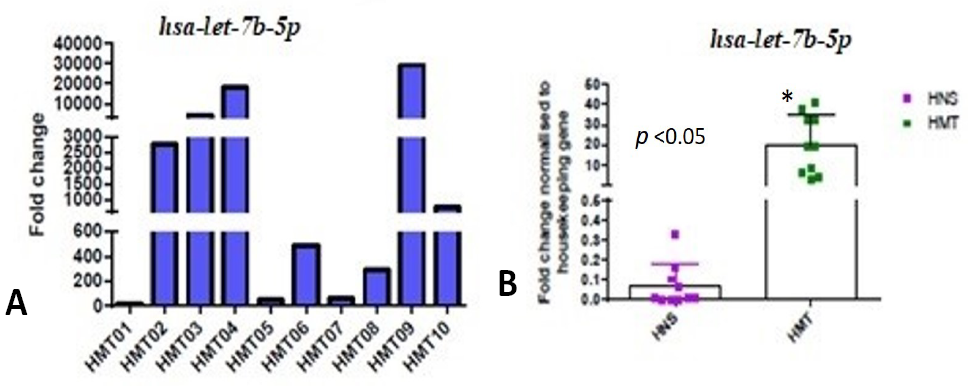
Expression level of hsa-let-7b-5p miRNA in human mammary tumor was measured using RT-qPCR (A) Data from three technically replicated measurements were averaged and normalized to the internal RNU6B control. Log 2-fold change values were calculated for 10 human mammary tumor samples (HMT). (B) Expression data of hsa-let-7b-5p miRNA (fold change), in human tumor (HMT) and normal mammary tissue (HNS) samples, was analyzed using GraphPad Prism software.
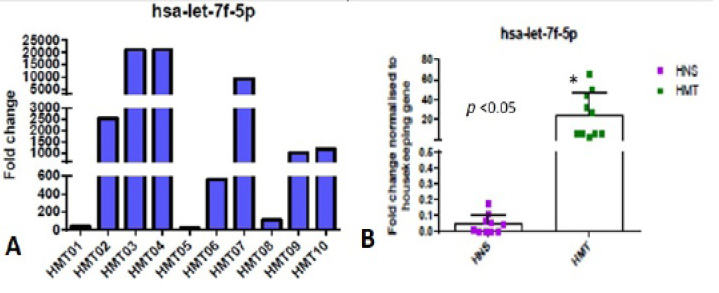
Expression level of hsa-let-7f-5p miRNA in human mammary tumor was measured using RT-qPCR (A) Data from three technically replicated measurements were averaged and normalized to the internal RNU6B control. Log 2-fold change values were calculated for 10 human mammary tumor samples (HMT). (B) Expression data of hsa-let-7f-5p miRNA (fold change), in human tumor (HMT) and normal mammary tissue (HNS) samples, was analyzed using GraphPad Prism software.
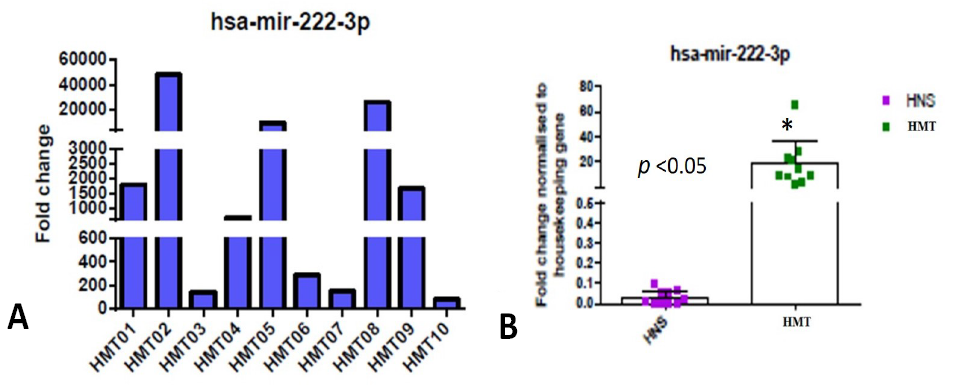
Expression level of hsa-mir-222-3p miRNA in human mammary tumor was measured using RT-qPCR (A) Data from three technically replicated measurements were averaged and normalized to the internal RNU6B control. Log 2-fold change values were calculated for 10 human mammary tumor samples (HMT). (B) Expression data of hsa-mir-222-3p miRNA (fold change), in human tumor (HMT) and normal mammary tissue (HNS) samples, was analyzed using GraphPad Prism software.
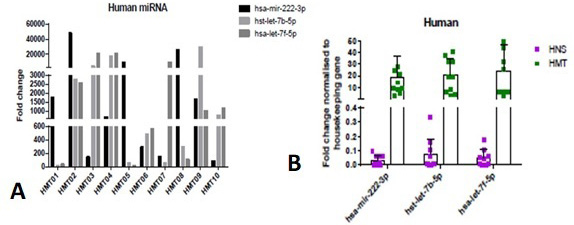
Comparison of hsa-mir-222-3p, hsa-let-7b-5p and hsa-let-7f-5p expression (fold change) in human mammary tumor samples (HMT): (A) using RT-qPCR, (B) using GraphPad Prism software.
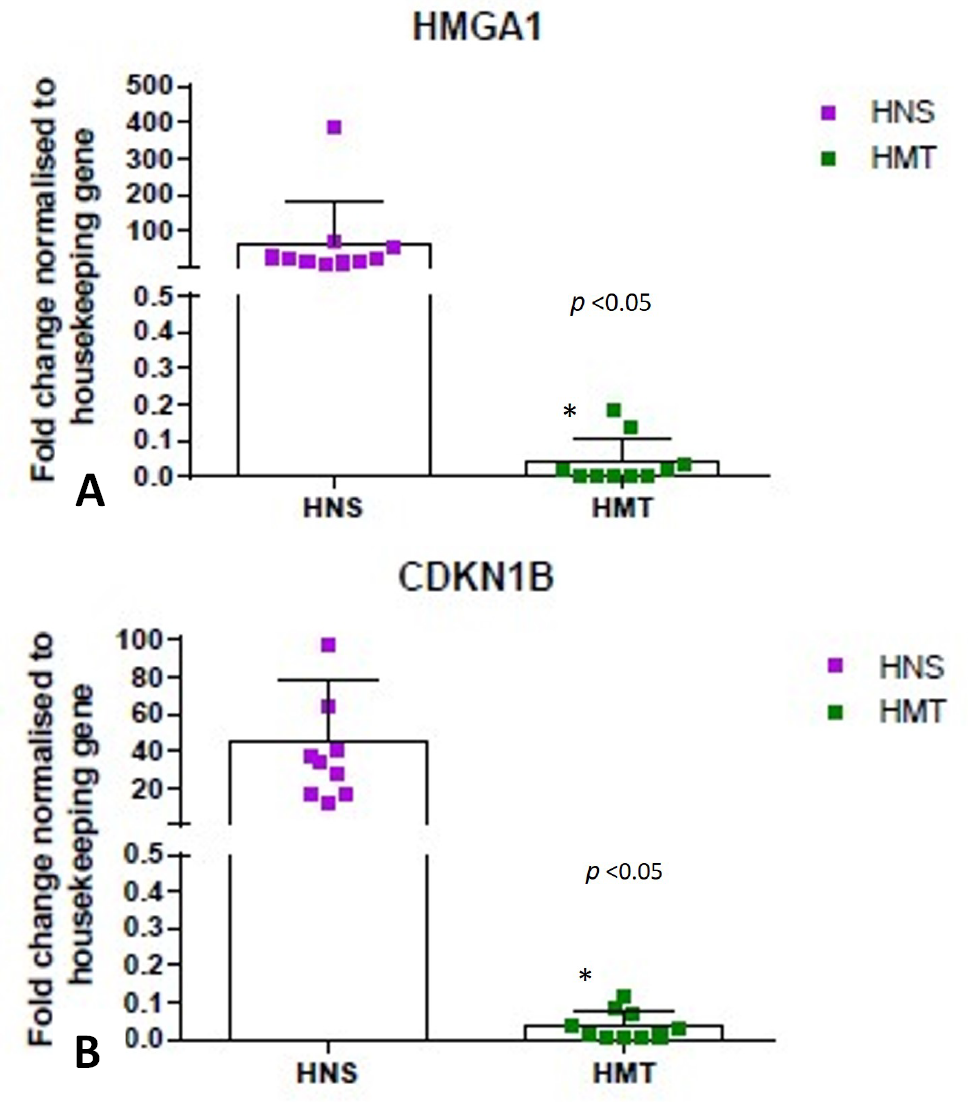
Expression data of HMGA1 (fold change) (A) and CDKN 1B (fold change) (B), in human tumor (HMT) and normal mammary tissue (HNS) samples, was analyzed using GraphPad Prism software.
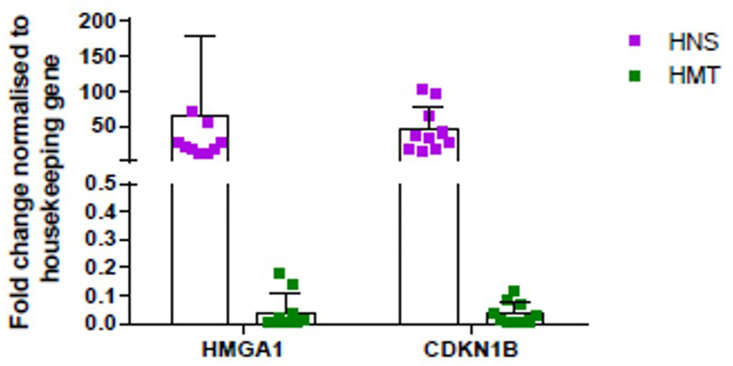
Comparison of expression data of HMGA1 and CDKN 1B (fold change), in human tumor (HMT) and normal mammary tissue (HNS) samples, was analyzed using GraphPad Prism software.


