Reproductive Behavior and Hormone Metabolite Profiles in Captive Breeding Female Sumatran Slow Lorises (Nycticebus hilleri)
Reproductive Behavior and Hormone Metabolite Profiles in Captive Breeding Female Sumatran Slow Lorises (Nycticebus hilleri)
Luthfiralda Sjahfirdi1*, Lisa Nurfalah1, Deanvi Fahira Wisnuputri1, Entang Iskandar2
Proportion of nocturnal behaviors (travel, resting, auto grooming, feeding, reproductive, social, and unseen behaviors) in female slow lorises in cage no. 2 (K2) and in cage no. 5 (K5) during study.
Pattern of female Sumatran slow loris behavior in cage no.5 (K5) observed daily from 17:00 to 05:00 WIB during study.
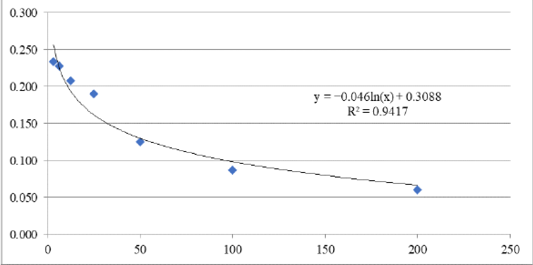
Standard curve of Estrone Conjugate (E1C) at 450-nm optical density (OD). Description: X axes = Concentration and Y axes = Absorbance.
Estrone Conjugare (E1C) hormone profiles of the female sumatran slow loris in cage no. 2 (K2) and in cage no.5 (K5) in captivity (pg/g) during study. Note: Black circles (O) indicate E1C peaks. Description: X axes = days and Y axes = E1C level (pg/g).
Standard curve of Pregnaneolone Glucuronide (PdG) at 450-nm optical density (OD). Description: X axes = Concentration and Y axes = Absorbance.
Pregnenolone Glucuronide (PdG) hormone profiles of the female sumatran slow loris in cage no.2 (K2) and in cage no.5 (K5) in captivity (pg/g). Note: Black circles indicate PdG peaks. Description: X axes = days and Y axes = PdG level (pg/g).
Pattern of female sumatran slow loris behavior in cage no.2 (K2) observed daily from 17:00 to 05:00 WIB during study.


