

Study on the Treatment of Experimental Dermatitis with Ginkgo biloba Leaf Extract and Quercetin


Study on the Treatment of Experimental Dermatitis with Ginkgo biloba Leaf Extract and Quercetin
Minghui Xiao, Minjie Huang, Jie Dong and Deqian Wang*
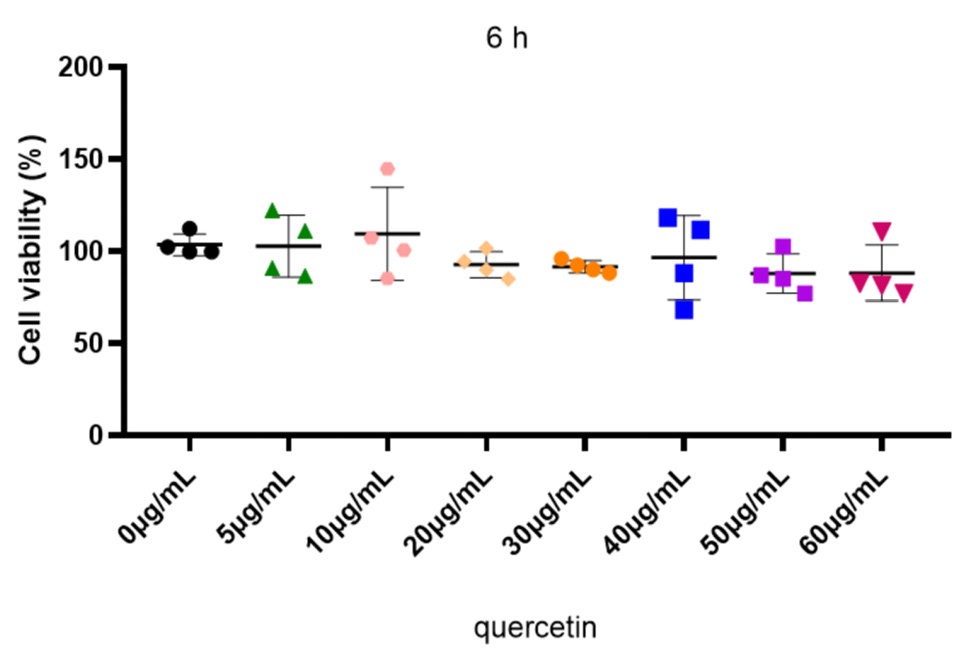
Fig. 1.
Effects of different concentrations of quercetin on the cell viability of P815 cells. Data are expressed as the mean±SD (n = 4).
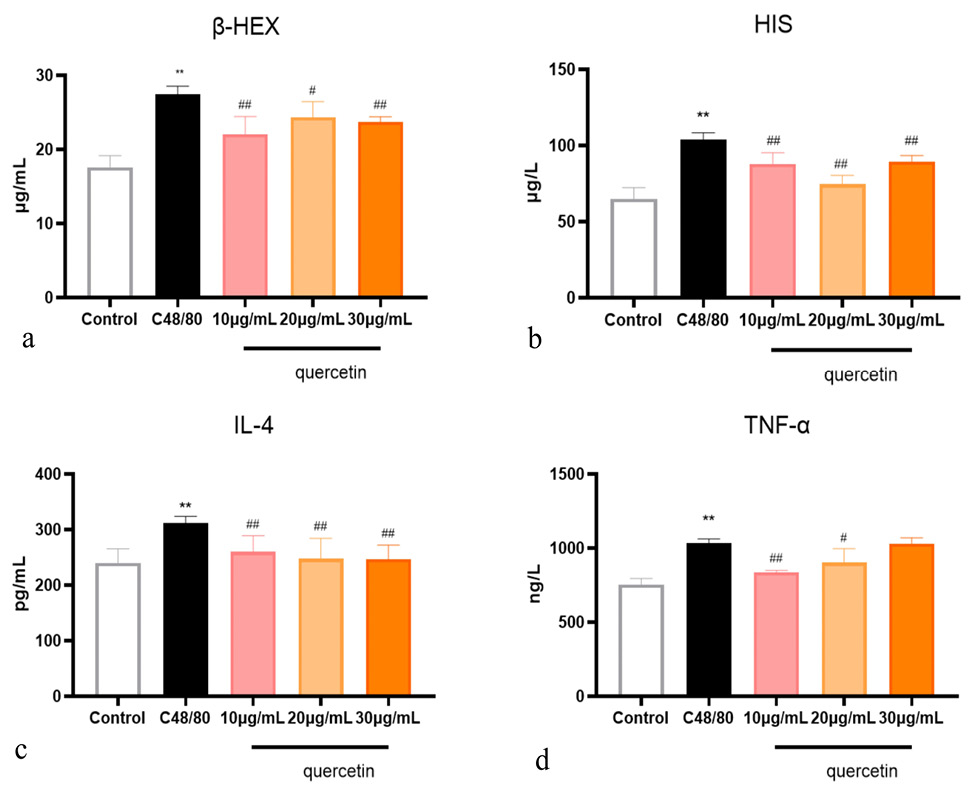
Fig. 2.
Effects of quercetin on the inflammation levels in P815 degranulation model. Data are expressed as the mean±SD (n = 6); *P<0.05, **P<0.01 vs. Control; #P<0.05, ##P<0.01 vs. C48/80. β-Hex, Beta-hexosaminidase; HIS, histamine; IL-4, interleukin 4; TNF-α, tumor necrosis factor-α.
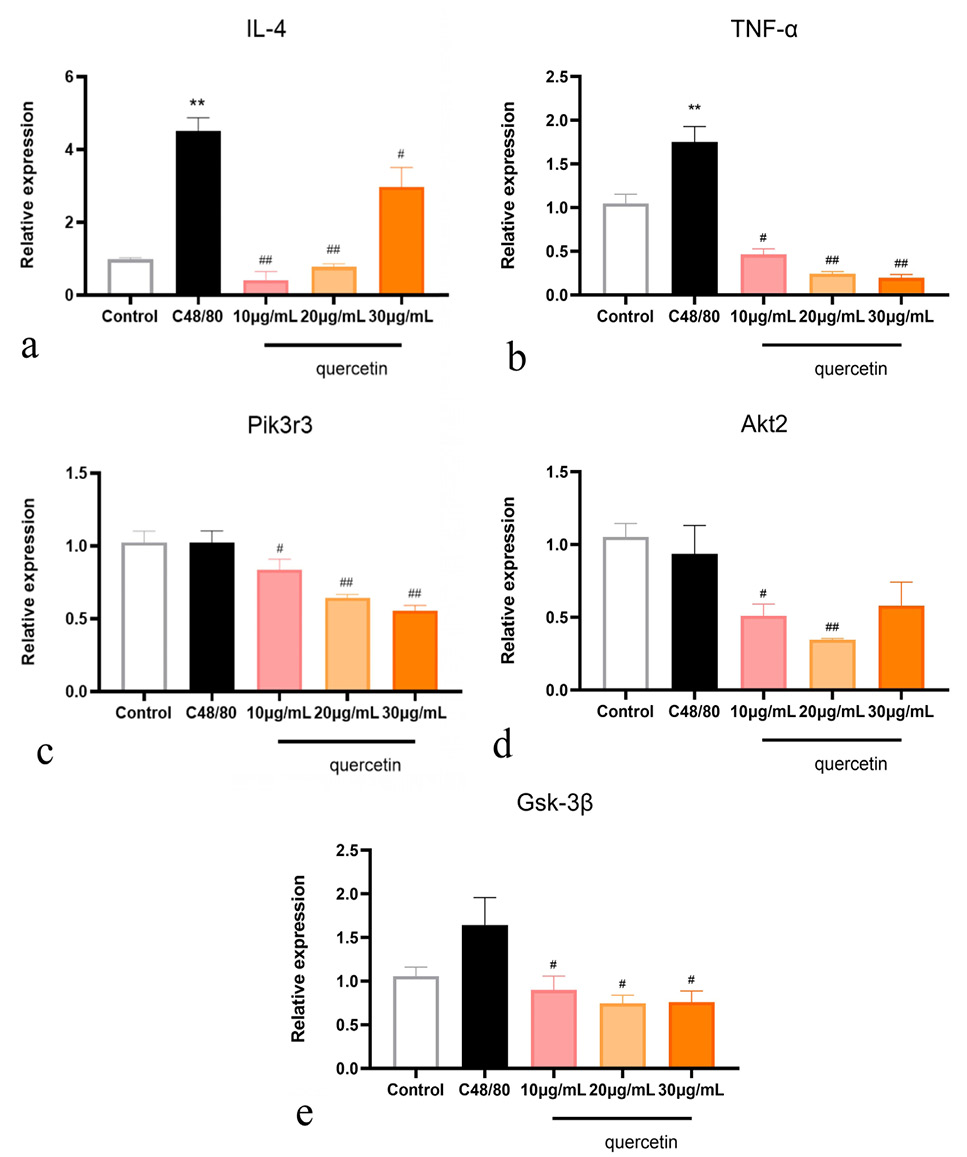
Fig. 3.
Effect of quercetin on the relative expression of inflammation related mRNA in P815 degranulation model.
Data are expressed as the mean±SD (n = 6); *P<0.05, **P<0.01 vs. Control; #P<0.05, ##P<0.01 vs. C48/80. Pik3r3, phosphoinositide-3-kinase regulatory subunit 3; Akt2, RAC-beta serine/threonine-protein kinase; GSK-3β, glycogen synthase kinase-3 beta. For other abbreviations see Figure 2.
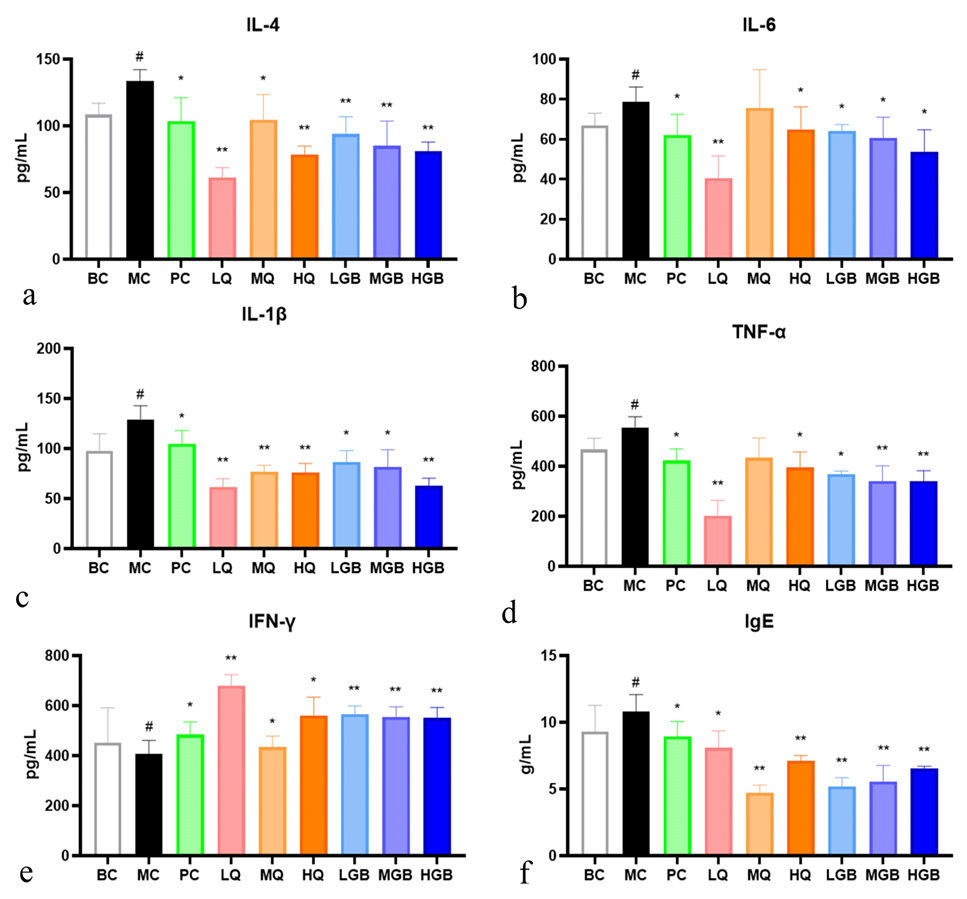
Fig. 4.
Effects of different doses of quercetin and G. biloba leaf extract on serum biochemical indexes in ACD mice. Data are expressed as the mean±SD (n = 8); #P<0.05, ##P<0.01 vs. BC group; *P<0.05, **P<0.01 vs. MC group.
IFN-γ, Interferon gamma; IgE, immunoglobulin E.
BC, blank control; MC, model control (0.3 mg/kg DNCB); PC, positive control (loratadine); LQ, 2 g/kg quercetin; MQ, 4 g/kg quercetin; HQ, 6 g/kg quercetin; LGB, 2 g/kg G. biloba leaf extract; MGB, 4 g/kg G. biloba leaf extract; HGB, 6 g/kg G. biloba leaf extract. For other abbreviations see Figure 2.
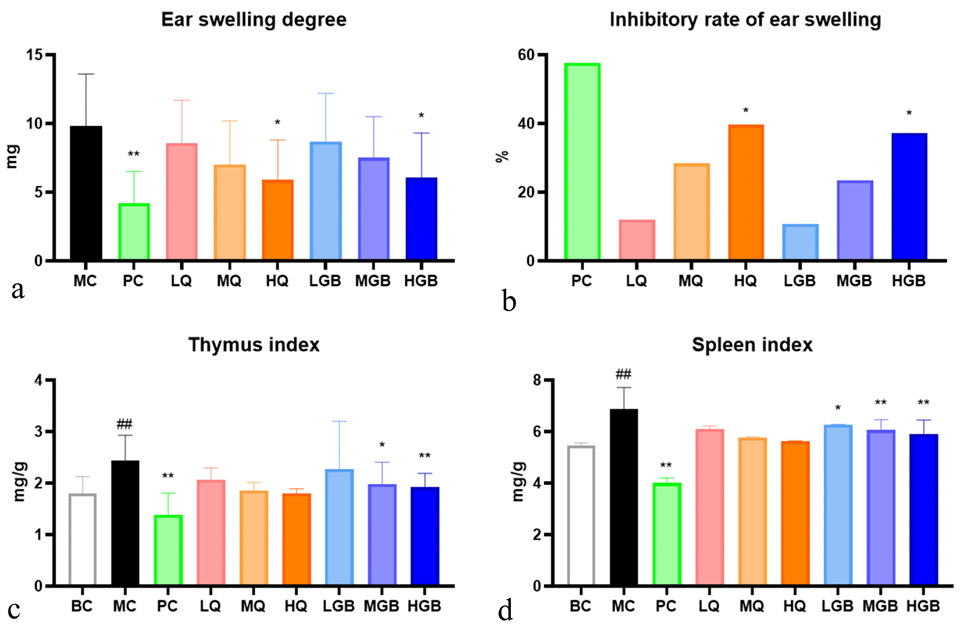
Fig. 5.
Comparison of the thymus index and spleen index in each group. Data are expressed as the mean±SD (n = 8); #P<0.05, ##P<0.01 vs. BC group; *P<0.05, **P<0.01 vs. MC group. For other abbreviation see Figure 4.
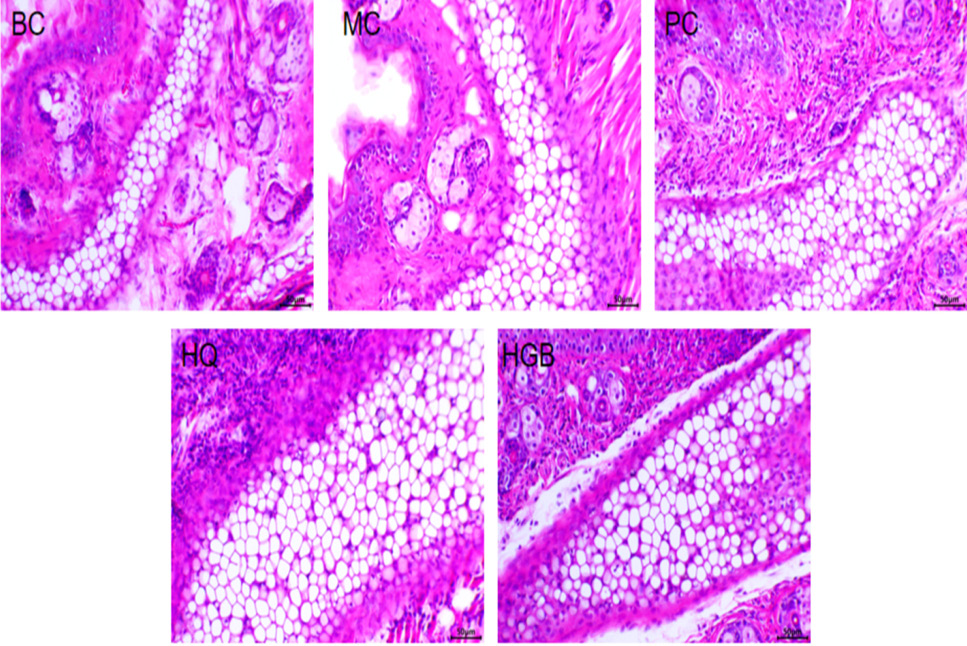
Fig. 6.
Histopathological micrographs of ear slices of mice in each group (X200). For other abbreviation see Figure 4.
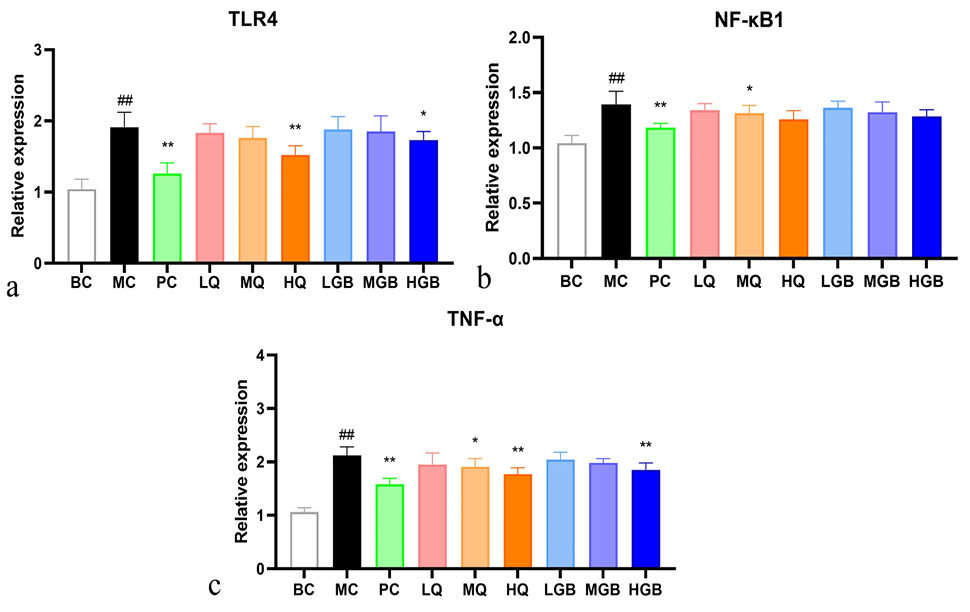
Fig. 7.
Relative expression of inflammation related genes in mouse. Data are expressed as the mean±SD (n = 8); #P<0.05, ##P<0.01 vs. BC group; *P<0.05, **P<0.01 vs. MC group. For other abbreviation see Figure 4.

November 2024
Pakistan J. Zool., Vol. 56
